
Call them chief financial officers. Or senior vice presidents of finance. Or just the head bean counters. These are people who perhaps best understand and rely on benchmarks to gauge the performance of their credit unions relative to the industry.
But they’re not the only ones who can glean valuable information from these metrics. Marketers, lenders, the rest of the C-suite, and every other stakeholder in the back office can learn about how the credit union movement is doing on the balance sheet and beyond.
Some of the easiest metrics for non-accountants to grasp are those that have been capturing industry headlines record lending levels and asset growth, for example. But continuing tight margins from sustained low interest rates and slowly rising operating expenses make some other benchmarks worth watching.
Here’s a look at four of them.
Save Time. Improve Performance.
![]() NCUA and FDIC data is right at your fingertips. Build displays, filter data, track performance, and more with Callahan’s Peer-to-Peer analytics.
NCUA and FDIC data is right at your fingertips. Build displays, filter data, track performance, and more with Callahan’s Peer-to-Peer analytics.
Efficiency
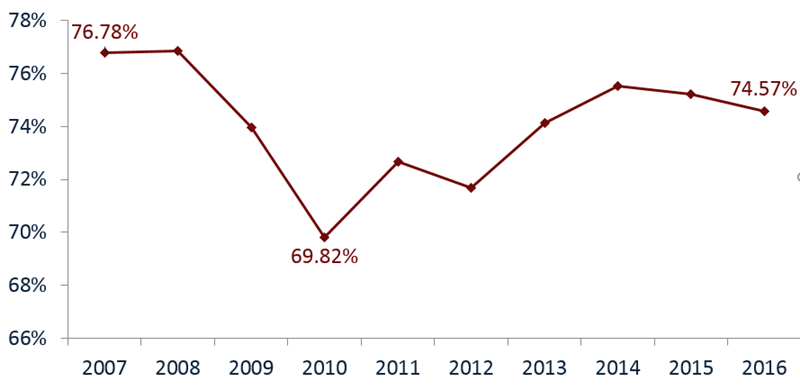
In general terms, the efficiency ratio measures how much the credit union spends to create $1 of revenue. Typically, a lower efficiency ratio is desirable, as long as it doesn’t come at the expense of member service.
In theory, credit unions with higher ratios of fee income to total income should experience less fluctuation in the efficiency ratio than credit unions with little fee income. Notice how the belt-tightening response to the recession is evident in the sharp drop for the industry as a whole in 2010.
EFFICIENCY RATIO
For all credit unions | Data as of 03.31.16
Callahan Associates | www.creditunions.com
Source: Peer-to-Peer Analytics by Callahan Associates
Return On Assets
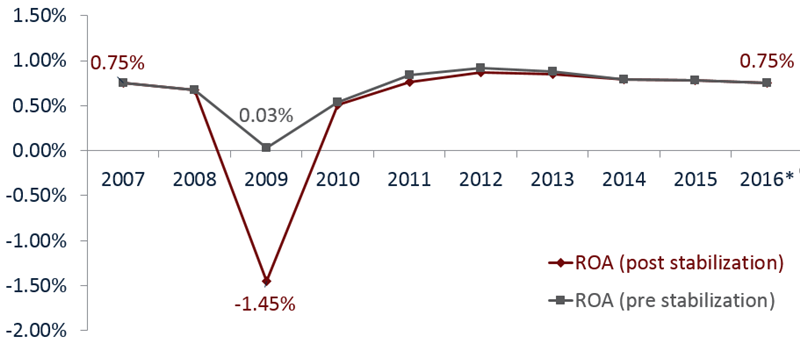
At first glance, this is a simple calculation: annual net income divided by average total assets.
But there’s a lot more to the story.
Income of all kinds as well as productivity and profitability influence ROA. Just because an institution has a high ROA doesn’t mean it’s performing well. Serving members best takes a balance of fee income and interest rates high enough to stay in business. After a 2009 dip, ROA as a whole has risen throughout the industry, with accelerating loan and asset growth outpacing net income growth.
RETURN ON ASSETS
For U.S. credit unions | Data as of 03.31.16
Callahan Associates | www.creditunions.com
Source: Peer-to-Peer Analytics by Callahan Associates
Coverage Ratio
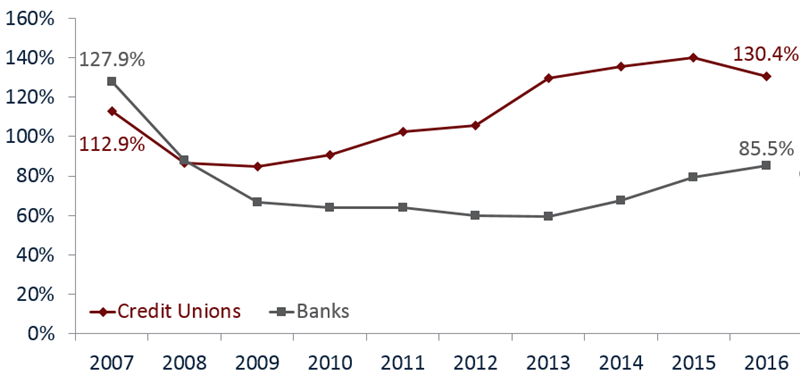
The coverage ratio looks at the allowance account relative to non-performing i.e., delinquent loans. It is a quick test of how well the credit union is prepared to absorb losses in the event it has to charge-off every delinquent loan.
Managing an allowance account via the provision expense is an art and takes a strong understanding of how the entire loan portfolio is performing, the credit union’s member demographics and performance trends, and the state of the broader general economy. As the chart shows, credit unions have a higher coverage ratio than banks, perhaps a product of the movement’s generally conservative nature and the regulatory environment.
COVERAGE RATIO
For U.S. credit unions | Data as of 03.31.16
Callahan Associates | www.creditunions.com
Source: Peer-to-Peer Analytics by Callahan Associates
Net Interest Margin To Operating Expenses
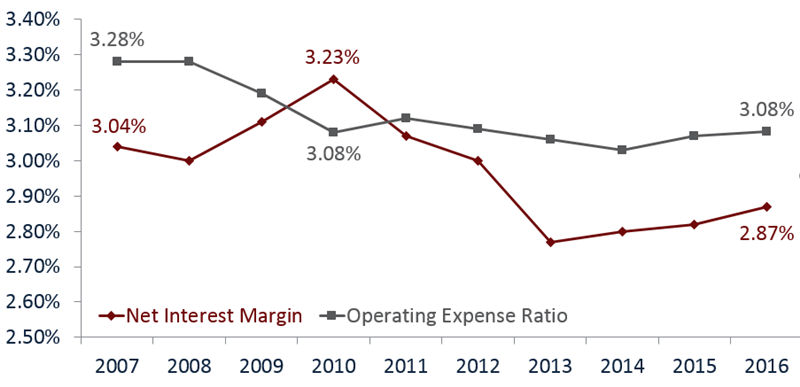
Part of every CFO’s job is balancing revenue and expenses. The net interest margin is net interest income less interest expenses (dividends on shares and interest on deposits and borrowed money) divided by average assets. Comparing both interest income less interest expenses and non-interest expenses to average assets creates a common comparison that provides a better picture into the business model of the institution.
In general, the net interest margin for the industry is less than its operating expense ratio and has been since June 2011. In order to be profitable, institutions must supplement interest income with non-interest sources such as fee and other operating income. Low interest rate environments like the past couple of years exaggerate that need.
The net interest margin has posted a slight uptick and the spread appears to be closing slightly. Moving forward, this will be a necessary measure to monitor as the Federal Reserve deliberates on continued gradual interest rate hikes.
NET INTEREST MARGIN VERSUS
OPERATING EXPENSES
For U.S. credit unions | Data as of 03.31.16
Callahan Associates | www.creditunions.com
Source: Peer-to-Peer Analytics by Callahan Associates
This post appeared originally on Credit Union Times.
You Might Also Enjoy
- 7 Ways To Manage Risk
- 5 Years Of Credit Union Mergers
- 7 Metrics To Track HR Success
- 7 Ratios Every Employee Should Know About Credit Union Lending