With the ever-changing rate environment and constant pressure to produce loans, it can be difficult for credit union CLOs to sort through the clutter and determine how well the credit union is reaching members and the quality of loans it is writing. The measures below are a good place to start to gain a big-picture understanding of a credit union’s lending operations and performance.
1. Average Member Relationship
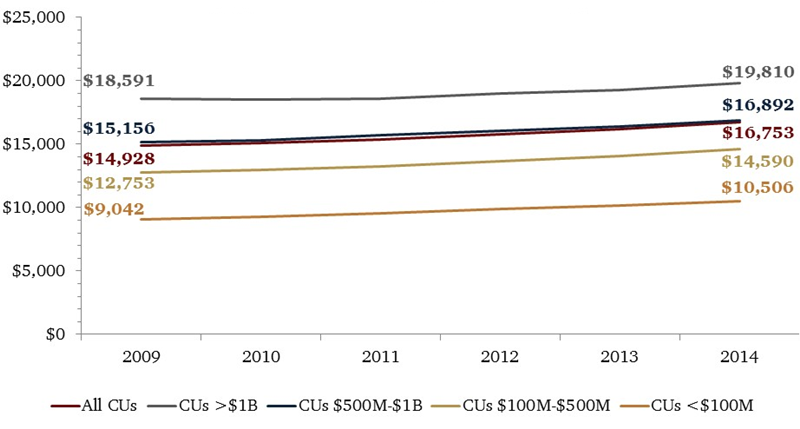
Definition: Average member relationship divides the sum of loans outstanding and total shares by the number of members the credit union serves. The average member relationship national average as of year-end 2014 is $16,753.
| Loans Outstanding ($) + Total Shares ($) |
| Current Members (#) |
Average Member Relationship
Data as of Dec. 31
Callahan Associates |
Source: Peer-to-Peer Analytics by Callahan Associates
The average member relationship represents the average value of loans and deposits individual members have with the credit union. The credit union’s pricing strategy, underwriting policies, and product mix all contribute to this performance measure. In addition, the make up of the membership, the economic environment, and the credit union’s ability to sell loan and deposit products can also have measurable impact on the average member relationship.
2. Delinquency Ratio
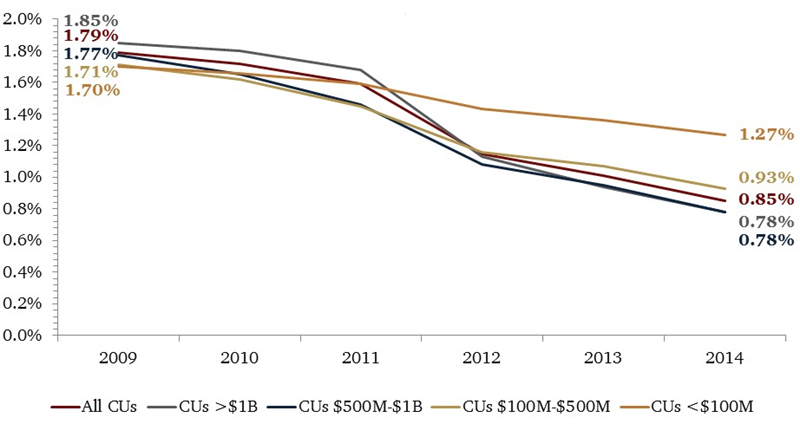
Definition: The delinquency ratio divides the total amount of delinquent loans by the total amount of loans outstanding. The delinquency ratio national average as of year-end 2014 is 0.85%.
| Delinquent Loans ($) |
| Loans Outstanding ($) |
Delinquency
Data as of Dec. 31
Callahan Associates |
Source: Peer-to-Peer Analytics by Callahan Associates
The delinquency ratio measures the credit risk of a credit union’s loan portfolio. It is a forecaster of future loan loss; therefore, unusual increases or decreases generally affect future earnings. The level of delinquency a credit union can sustain is a function of several factors, including loan income, credit risk management, and loan loss management. Risk-based pricing is often accompanied by higher delinquency, but credit unions typically compensate for that higher delinquency by charging higher interest rates and in turn, achieving higher loan yields. A low delinquency rate, on the other hand, can imply a credit union’s underwriting policies are too conservative. Credit unions should evaluate this ratio in conjunction with their loan-to-share ratio, loan loss ratio, and ROA.
3. Net Charge-Offs Ratio
Definition: The net charge-offs ratio subtracts year-to-date recoveries from year-to-date charge-offs and divides the difference by the amount of average loans outstanding. The net charge-offs ratio national average as of year-end 2014 is 0.49%.
| YTD Charge-Offs YTD Recoveries |
| Average Loans Outstanding ($) |
Net Charge-Offs
Data as of Dec. 31
Callahan Associates |

Source: Peer-to-Peer Analytics by Callahan Associates
The net charge-offs ratio measures the credit union’s history of credit risk management and directly influences a credit union’s ROA. In general, the lower the ratio, the healthier the credit union. Credit risk management strategies that influence the charge-off ratio primarily include underwriting and debt collection. As such, risk-based pricing, membership demographics, loan mix, and collection timeliness and aggressiveness all contribute to a credit union’s charge-off levels. Changes in lending strategies typically take 12 to 18 months to be reflected in charge-off statistics.
4. Coverage Ratio
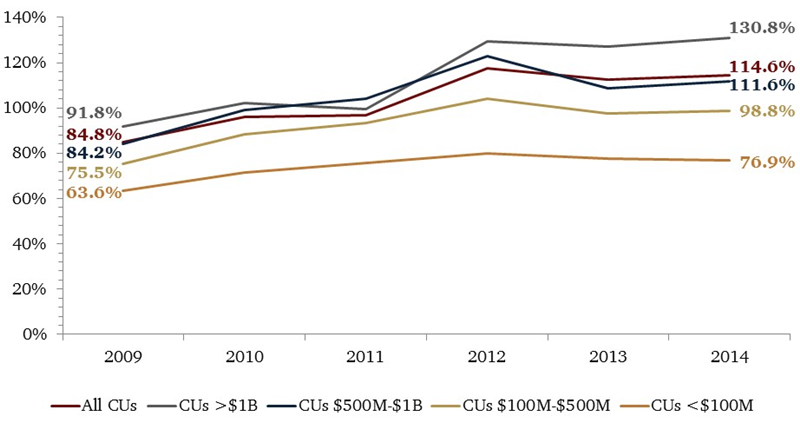
Definition: The coverage ratio divides the allowance for loan and lease losses by the amount of delinquent loans. The coverage ratio national average as of year-end 2014 is 114.6%.
| Allowance for Loan Lease Losses |
| Delinquent Loans ($) |
Coverage Ratio
Data as of Dec. 31
Callahan Associates |
Source: Peer-to-Peer Analytics by Callahan Associates
The coverage ratio measures the adequacy of the credit union’s reserves to cover potential losses in its loan portfolio. Delinquent loans forecast future losses; the allowance for loan losses is the reserves an institution sets aside to cover loan losses. Because a credit union funds the allowance from current earnings, a declining ratio from an increase in delinquent loans indicates the credit union will have to increase the allowance account as those loans turn into losses. A declining trend in the ratio indicates an under-funded allowance.
5. Loan-To-Share Ratio
Definition: The loan-to-share ratio divides the total amount of loans outstanding by the total amount of share deposits at the credit union. The loan-to-share ratio national average as of year-end 2014 is 74.8%.
| Loans Outstanding ($) |
| Share Deposits ($) |
Loan-to-Share
Data as of Dec. 31
Callahan Associates |

A credit union’s loan and deposit acquisition performance drives its loan-to-share ratio. Most credit unions concentrate on building the loan portfolio rather than focus on deposits, unless liquidity is an issue. In general, a credit union’s operations sales culture, marketing, product development, risk management, etc. influences loan growth more than deposit growth. Non-operational factors, such as membership demographics, are what generally influence deposit growth. In general, a higher loan-to-share ratio indicates greater profitability.
Superior Analysis At Your Fingertips
Benchmark performance, build peer groups, run reports, and more with Callahan’s data software.
You Might Also Enjoy
- 5 Ratios Every CEO Must Know
- 3 Ratios Every CLO Must Know
- >4 Ratios Every HR Professional Should Know
- 4 Ratios All Staff Should Know