Read the full analysis or skip to the section you want to read by clicking on the links below.
LENDING AUTO LENDING MORTGAGE LENDING CREDIT CARDS MEMBER BUSINESS LENDING SHARES INVESTMENTS MEMBER RELATIONSHIPS EARNINGS SPECIAL SECTION: PRODUCTIVITY & EFFICIENCY
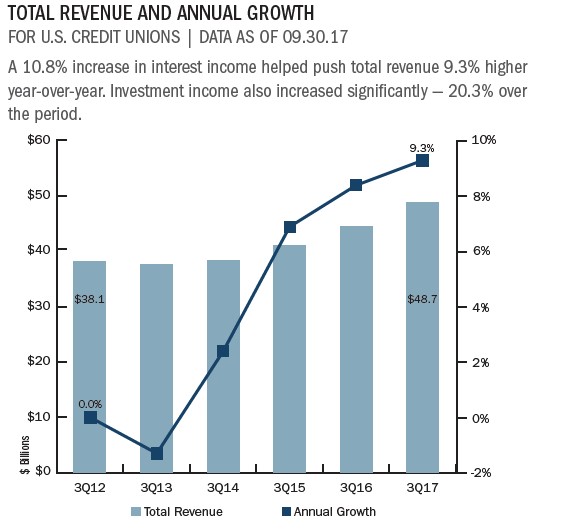
Operating revenue totaled $48.7 billion as of Sept. 30, 2017. That’s a year-over-year increase of 9.3%.
The net interest margin for the industry increased 9 basis points year-over-year to 2.98%. Interest income increased 10.8% annually to $35.5 billion. Non-interest income grew 4.4% year-over-year adding $572.9 million to the NII coffer and surpassed $13.5 billion as of Sept. 30. Fee income and other operating income grew by similar rates of 5.5% and 5.6%, respectively.
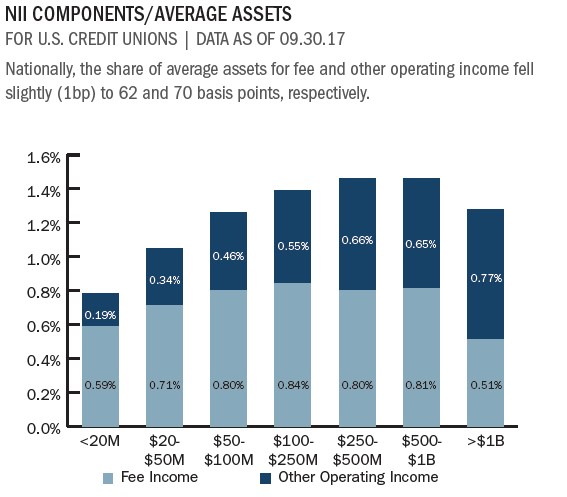
The industry’s income composition has remained fairly consistent over the past five years; however, the non-interest income components fee income and other operating income have shifted. In third quarter 2012, fee income accounted for 14.4% of income, whereas other operating income accounted for 12.8%. In third quarter 2017, other operating income accounted for 14.4% of income and fee income 12.8%.
The largest driver of income in the third quarter of 2017 was net loan interest income, which accounted for 63.8% of total income and totaled $31.1 billion.
Investments made up the smallest piece, 9%, of total income, yet they were the fastest growing component. Income from investments hit $4.4 billion as of Sept. 31. That’s an annual growth rate of 20.3%. Net loan interest income was next with 9.3% growth from third quarter 2016 to third quarter 2017.
Increases to the benchmark interest rate by the Fed have yet to significantly impact earnings at credit unions cost of funds increased 2 basis points compared to the same period one year ago. The 7.9% growth in net income compared to the relatively slower 6.7% growth in assets helped push return on assets 1 basis point higher to 0.79% as of Sept. 30, 2017. With asset growth at 6.4% and net income growth at 11.7%, return on assets was 0.79% as of third quarter.
Click the graphs below to enlarge and then continue reading to see how, for its size, HopeSouth Federal Credit Union makes a lot of money helping members.
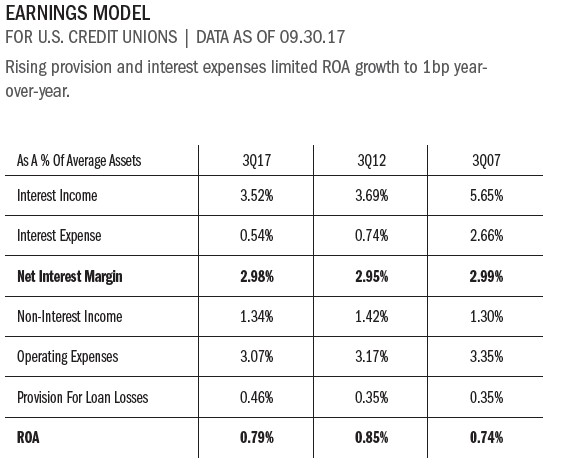
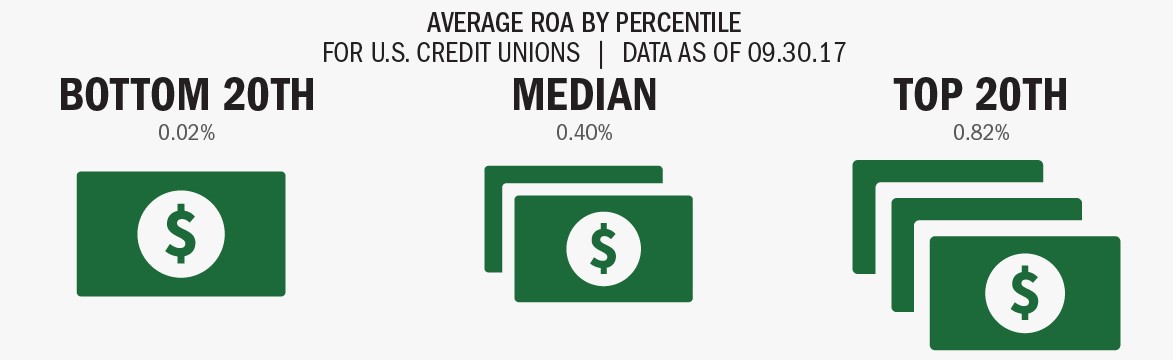
Nationally, ROA rose slightly from the second quarter of 2016 to 2017 as net income gains outpaced asset growth.
CASE STUDY
HOPESOUTH CREDIT UNION
For its size, HopeSouth Federal Credit Union makes a lot of money helping members, beginning with lending.
Everything we do here at the credit union is based around the fact we need to loan money to members, says Faye Crocker, CEO at the small-town South Carolina financial cooperative. That’s our core purpose. If we’re not doing that, I’m not sure why we’re doing anything.
HopeSouth has an average loan yield of 10.47% more than twice the national average of 4.54% a result of its commitment to keeping 30% to 35% of its lending in D and E paper.
We can afford to lend to all members if we price ourselves right, Crocker says.
This approach has helped HopeSouth consistently post well above average ROA, including 1.75% in the third quarter. That’s in the top 20 for credit unions with $10 million to $20 million in assets.
Fee income also matters at HopeSouth, which serves a primarily low-income field of membership. Members commonly come in nearly daily for $20 withdrawals. Many don’t qualify for the accounts that offer free transactions.
It’s important you price fairly, but you also can’t afford to not have those services pay for themselves, Crocker says.
Still, HopeSouth’s annualized fee income per member is not that much higher than the national average for all credit unions: $77 to $74, respectively, in the third quarter.
HopeSouth also stresses products that generate other operating income. Approximately 40% of the credit union’s borrowers buy GAP and credit disability products. Credit life penetration exceeds 50%.
Read The Whole Story

Strategy & Performance 3Q 2017
Credit unions have made significant gains since the Great Recession started 10 years ago. Third quarter credit union growth trends surged past that of community banks and the overall banking industry. Measures such as loans, shares, capital, andmembership have all reached new levels. These gains are all notable and meaningful; however, they are backward-looking. The important question to ask is: Where will credit unions be in the next 10 years? In this issue of Strategy & Performance,learn why now is the time for credit unions to challenge themselves.
Read More
RETURN TO INDUSTRY PERFORMANCE BY THE NUMBERS 3Q 2017