The seasonality of loan and deposit growth means credit unions ability to fund loans throughout the year has historically been contingent on their first quarter share growth.
Credit unions most commonly use shares to fund balance sheet loan growth. When share growth is not sufficient, credit unions must use other measures to free up liquidity, including selling portions of their investment portfolio, selling loans to the secondary market as well as in the form of participations, or borrowing funds if they are able to do so. For eight of the past 16 quarters, credit unions have posted quarter-over-quarter share growth exceeding 1%. Five of those occurrences were in the first quarter of the year. In contrast, quarterly loan growth has exceeded 1% for 18 of the past 19 quarters and exceeded 2% for 11 quarters.
No Funding Gap In Third Quarter
The third quarter of 2016 was the first quarter in the past three years to exhibit positive year-over-year net liquidity change, yet loans outstanding outpaced total share growth by 1.7 percentage points. Year-over-year loan growth has consistently exceeded 10% since the end of 2013, whereas share growth has slowly grown from 4.14% in the third quarter 2013 to 8.7% in the third quarter of 2016.
In the near term, credit unions should not have an issue funding their loan portfolio through share growth. Over the long run however, credit unions could face liquidity constraints if they are unable to spur deposit growth at a rate that keeps pace with sustained strong loan growth.
ANNUAL CHANGE IN NET LIQUIDITY
FOR U.S. CREDIT UNIONS | DATA AS OF 09.30.16
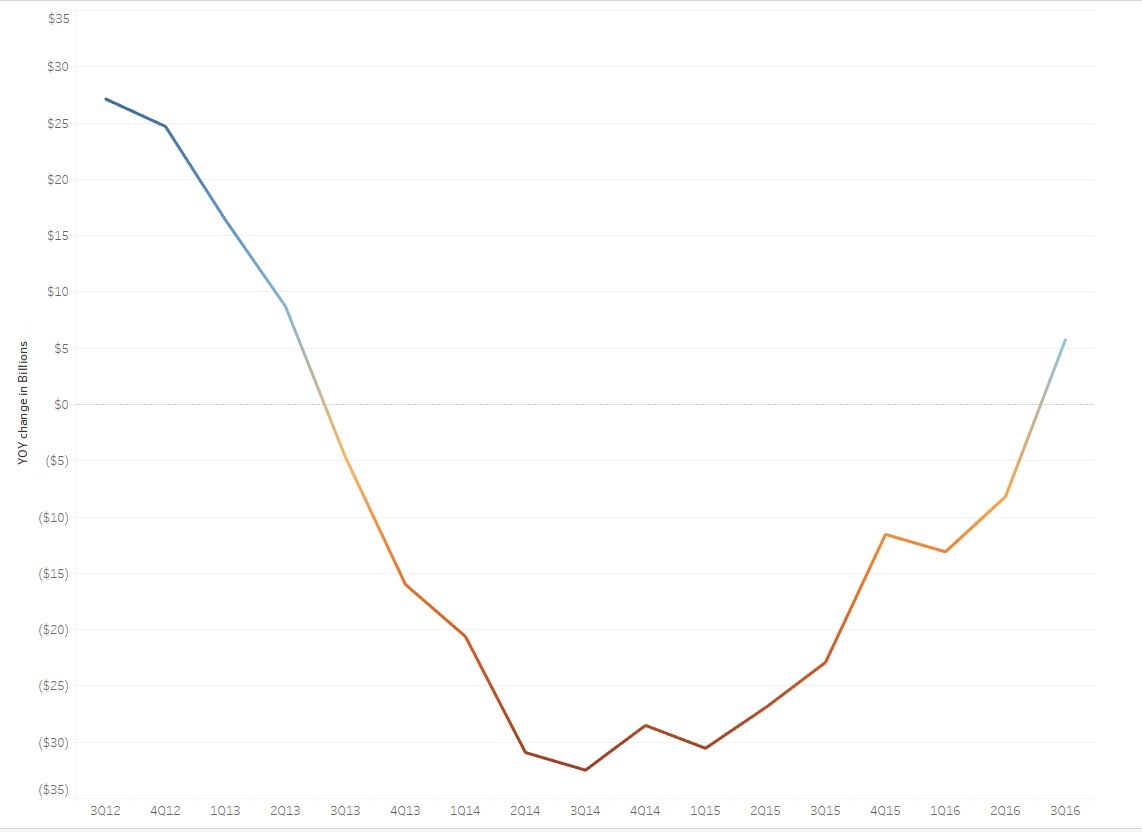
Source: Callahan & Associates.
Third quarter 2016 performance data shows credit unions posted the highest year-over-year share growth since fourth quarter 2009.Each type of share account increased faster than in 2015, with share drafts posting the fastest growth 17.85%.
Share certificates and IRA and Keogh accounts posted the strongest growth since second quarter 2009 and fourth quarter 2012, respectively. The growth in these accounts is indicative that members are becoming more willing to invest their savings in longerduration products.
And whereas loan demand remains strong, growth has begun to decelerate, dropping from a high of 10.75% in the first quarter of 2016 to 10.09% in the third quarter of 2016. This has helped to naturally ease liquidity pressures throughout the industry.
Where does your share growth, loan growth, and net liquidity stand in relation to your peers? Find out in mere minutes with Callahan Analytics. Learn more.
Future Outlook
In the past few years, credit unions had prioritized building share balances in the first quarter to fund loan originations for the remainder of the year. But more evenly spread share growth over the past four quarters indicates credit unions are awareof growing liquidity pressures and are managing them via organic deposit growth.
QUARTER-OVER-QUARTER SHARE GROWTH
FOR U.S. CREDIT UNIONS | DATA AS OF 09.30.16
Source: Callahan & Associates.
If credit unions can continue the impressive, varied share growth of the past four quarters, then the net liquidity rate will remain positive, permitting them to continue to fund future loan demand. If share growth and loan growth continue in their respectivetrends, credit unions will be able to fund future loan growth solely with share growth.
5 Tips To Evaluate Asset Liability Management
The seasonality of loan and deposit growth means credit unions ability to fund loans throughout the year has historically been contingent on their first quarter share growth.
Credit unions most commonly use shares to fund balance sheet loan growth. When share growth is not sufficient, credit unions must use other measures to free up liquidity, including selling portions of their investment portfolio, selling loans to the secondary market as well as in the form of participations, or borrowing funds if they are able to do so. For eight of the past 16 quarters, credit unions have posted quarter-over-quarter share growth exceeding 1%. Five of those occurrences were in the first quarter of the year. In contrast, quarterly loan growth has exceeded 1% for 18 of the past 19 quarters and exceeded 2% for 11 quarters.
No Funding Gap In Third Quarter
The third quarter of 2016 was the first quarter in the past three years to exhibit positive year-over-year net liquidity change, yet loans outstanding outpaced total share growth by 1.7 percentage points. Year-over-year loan growth has consistently exceeded 10% since the end of 2013, whereas share growth has slowly grown from 4.14% in the third quarter 2013 to 8.7% in the third quarter of 2016.
In the near term, credit unions should not have an issue funding their loan portfolio through share growth. Over the long run however, credit unions could face liquidity constraints if they are unable to spur deposit growth at a rate that keeps pace with sustained strong loan growth.
ANNUAL CHANGE IN NET LIQUIDITY
FOR U.S. CREDIT UNIONS | DATA AS OF 09.30.16
Source: Callahan & Associates.
Third quarter 2016 performance data shows credit unions posted the highest year-over-year share growth since fourth quarter 2009.Each type of share account increased faster than in 2015, with share drafts posting the fastest growth 17.85%.
Share certificates and IRA and Keogh accounts posted the strongest growth since second quarter 2009 and fourth quarter 2012, respectively. The growth in these accounts is indicative that members are becoming more willing to invest their savings in longerduration products.
And whereas loan demand remains strong, growth has begun to decelerate, dropping from a high of 10.75% in the first quarter of 2016 to 10.09% in the third quarter of 2016. This has helped to naturally ease liquidity pressures throughout the industry.
Where does your share growth, loan growth, and net liquidity stand in relation to your peers? Find out in mere minutes with Callahan Analytics. Learn more.
Future Outlook
In the past few years, credit unions had prioritized building share balances in the first quarter to fund loan originations for the remainder of the year. But more evenly spread share growth over the past four quarters indicates credit unions are awareof growing liquidity pressures and are managing them via organic deposit growth.
QUARTER-OVER-QUARTER SHARE GROWTH
FOR U.S. CREDIT UNIONS | DATA AS OF 09.30.16
Source: Callahan & Associates.
If credit unions can continue the impressive, varied share growth of the past four quarters, then the net liquidity rate will remain positive, permitting them to continue to fund future loan demand. If share growth and loan growth continue in their respectivetrends, credit unions will be able to fund future loan growth solely with share growth.
Daily Dose Of Industry Insights
Stay informed, inspired, and connected with the latest trends and best practices in the credit union industry by subscribing to the free CreditUnions.com newsletter.
Share this Post
Latest Articles
Fintech Grounded In Mission As Much As Market Opportunity
Industry Intelligence For Credit Union Leaders
Cost Pressures Are Changing Member Behavior
Keep Reading
Related Posts
Connection And Caring Matter As Much As Knowledge And Resources
Markets Flip From Pricing Cuts To 50% Chance Of Hikes
New Highs For Equity Markets Despite Iran And Oil Prices
Fintech Grounded In Mission As Much As Market Opportunity
Marc RapportIndustry Intelligence For Credit Union Leaders
Callahan & AssociatesCost Pressures Are Changing Member Behavior
Savana MorieView all posts in:
More on: