Top-Level Takeaways
-
The dependence on ATM, courtesy pay, and other checking fees among U.S. credit unions has tapered as fee income as a percentage of total assets has fallen sharply in the past decade.
-
A bump in two other measures of engagement checking accounts and credit card accounts suggests more members are making a credit union their primary financial institution.
The margin between interest rates for deposits and loans remains near historic lows, and the need for credit unions to develop alternative sources of income has not diminished.
What has tapered, however, is the dependence on the least consumer-friendly sources of revenue items like ATM fees, courtesy pay, and other checking account fees that fall under the label of non-interest income (NII).
To be sure, interest from loans remains by far the most important part of a credit union’s income stream. That’s not surprising considering credit unions exist to extend credit. That’s where credit unions build relationships and help members get to work, own a home, and educate themselves and their children.ContentMiddleAd
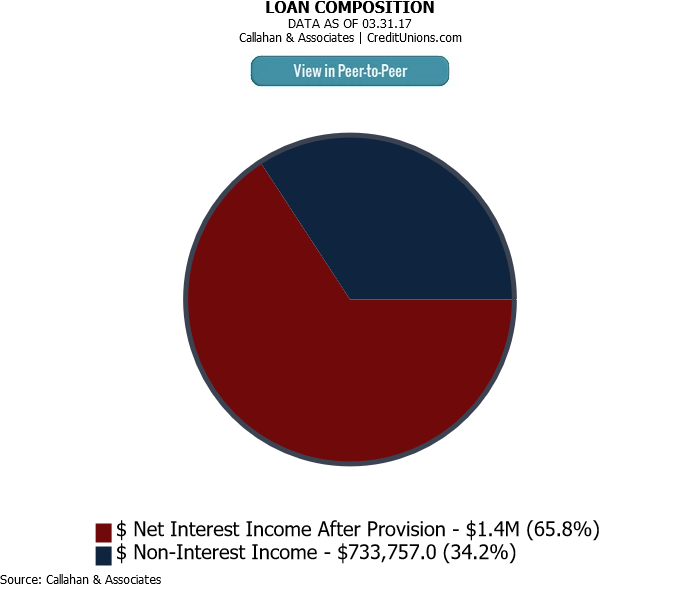
Indeed, interest income, which includes the smaller component of income from investments, makes up approximately two-thirds of all credit union income, in this case $1.4 billion annualized in the first quarter of 2017 compared with $728.6 million for NII, according to data from Callahan & Associates.
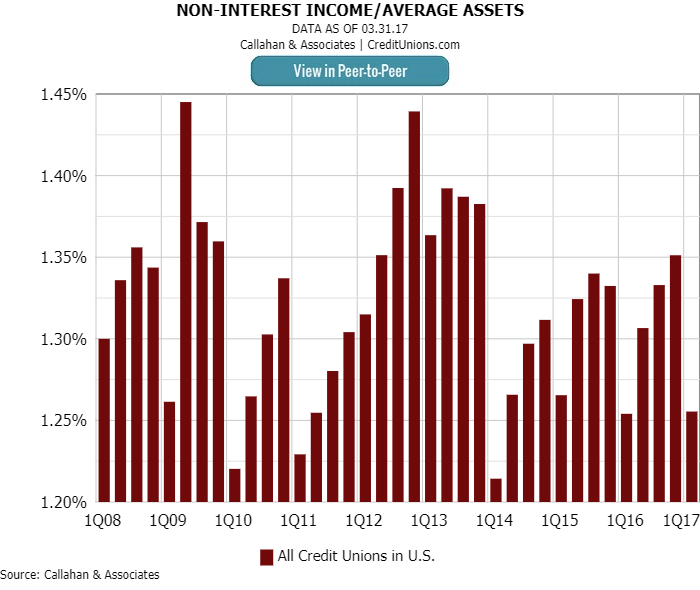
That proportion hasn’t changed much. Nor has another key measure of the importance of NII. As a percentage of average assets, NII was 1.30% in the first quarter of 2008. At the same point this year, it was 1.26%, a drop of only 4 basis points. (Its largest spike was to 1.44% in second quarter 2009 as the loan portfolio contracted in the height of the financial crisis.)
However, and this a big however, fee income as a percentage of total credit union assets has fallen sharply in the past decade, from 0.83% in first quarter 2008 to 0.60% in first quarter 2017. That’s 23 basis points, but it’s also 25% less dependence on punitive fees.
Click the tabs below to examine industrywide financial performance. Click on the graphs to view them in Peer-to-Peer.
Credit Card Penetration
Fee Income/ Average Assets

Income Comparison
Non-Interest Income/ Average Assets
Other Income/ Average Assets
Share Draft Penetration
5-Year Net Interest Income CAGR Leaders
5-YEAR NET INTEREST INCOME CAGR LEADERS
FOR US CREDIT UNIONS | DATA AS OF 03.31.17
© Callahan & Associates | www.creditunions.com
| Rank |
State |
Name |
$ Net Interest Income After Provision |
| 1 |
NV |
Silver State Schools |
61.83% |
| 2 |
WI |
Connexus |
39.37% |
| 3 |
CO |
Premier Members |
38.93% |
| 4 |
OH |
Pathways Financial |
29.21% |
| 5 |
CA |
California Bear |
28.62% |
| 6 |
VT |
Vermont State Employees |
27.35% |
| 7 |
NC |
Latino Community |
27.11% |
| 8 |
WI |
Capital |
24.60% |
| 9 |
MI |
Members First |
24.25% |
| 10 |
NC |
Self-Help |
23.74% |
| 11 |
MI |
4Front |
23.52% |
| 12 |
PA |
CACL |
22.94% |
| 13 |
CA |
Matadors Community |
22.93% |
| 14 |
AL |
New Horizons |
22.11% |
| 15 |
MD |
Educational Systems |
22.02% |
| 16 |
OH |
Telhio |
21.18% |
| 17 |
WI |
Verve |
20.26% |
| 18 |
MI |
Michigan Schools and Government |
19.63% |
| 19 |
NE |
Lincone |
19.56% |
| 20 |
WY |
Blue |
19.55% |
Source: Callahan & Associates.
2017 Callahan & Associates, Inc. All rights reserved
5-Year Non-Interest Income CAGR Leaders
5-YEAR NON-INTEREST INCOME CAGR LEADERS
FOR US CREDIT UNIONS | DATA AS OF 03.31.17
© Callahan & Associates | www.creditunions.com
| Rank |
State |
Name |
$ Net Interest Income After Provision |
| 1 |
TX |
Pioneer Mutual |
75.47% |
| 2 |
CO |
Denver Fire Department |
63.20% |
| 3 |
TX |
Santa Fe |
51.50% |
| 4 |
CA |
Schools |
50.26% |
| 5 |
NM |
Guadalupe |
46.92% |
| 6 |
WI |
Connexus |
46.05% |
| 7 |
MA |
Alden |
39.03% |
| 8 |
IN |
Evansville Teachers |
38.97% |
| 9 |
WI |
Capital |
38.43% |
| 10 |
OH |
Pathways Financial |
36.52% |
| 11 |
PA |
CACL |
33.88% |
| 12 |
NY |
Ukranian National |
31.16% |
| 13 |
MA |
Southern Mass |
30.88% |
| 14 |
OH |
General Electric |
30.03% |
| 15 |
NC |
Self-Help |
29.71% |
| 16 |
MN |
South Metro |
28.93% |
| 17 |
TX |
Texas Tech |
28.78% |
| 18 |
OR |
Trailhead |
28.33% |
| 19 |
KS |
Azura |
27.74% |
| 20 |
IL |
Partnership Financial |
27.68% |
Source: Callahan & Associates.
2017 Callahan & Associates, Inc. All rights reserved
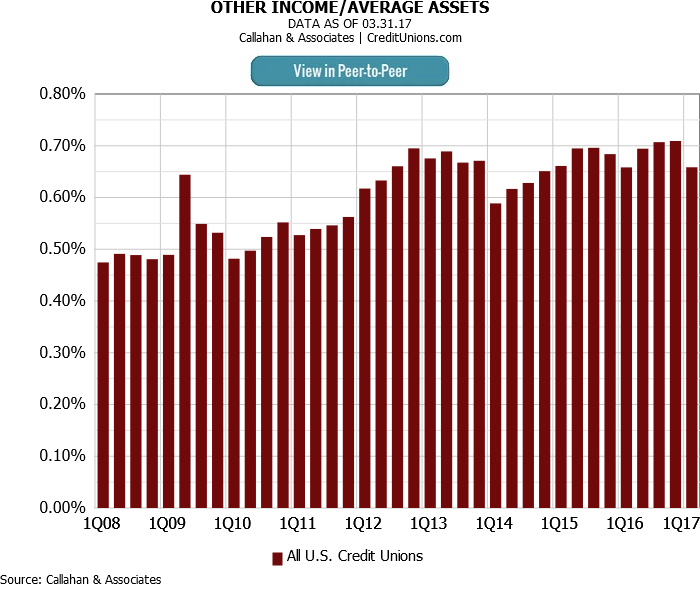
Meanwhile, what has gone up sharply is other income a category that includes such items as GAP insurance, gains from mortgage sales, loan participations, and debit and credit interchange income.
During the same decade that fee income fell by 23 basis points, other income rose 19 basis points, from 0.47% in first quarter 2008 to 0.66% in first quarter 2017 as a percentage of total assets, Callahan data shows.
American consumers attracted by lower fees and rates have increased their business with credit unions. In return, credit unions continue to offer even better fees and rates.
So, what do all these numbers mean? Credit unions have been enlarging a virtuous circle of growth. They offer lower fees. American consumers attracted by lower fees and rates have increased their business with credit unions by making financial cooperatives their primary financial institution (PFI). In return, credit unions continue to offer even better fees and rates.
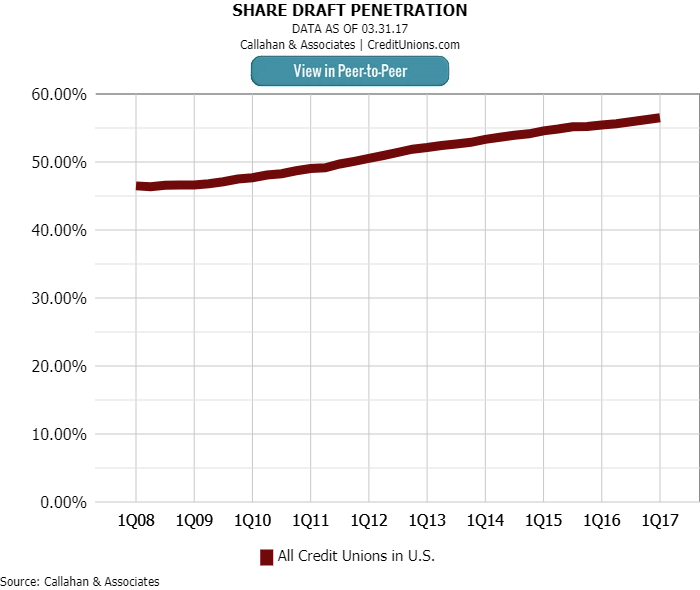
We see the bump in standing as a PFI in two other measures of engagement. Checking accounts are a prime indicator of an institution’s status as the PFI, and credit card accounts are a viable measure, too.
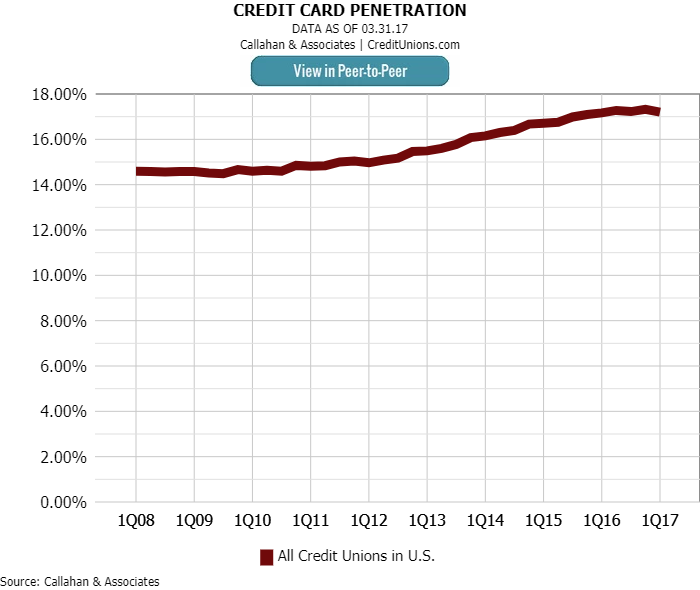
Share draft penetration went from 46.46% in first quarter 2008 to 56.49% in first quarter 2017. That’s a robust increase of 21.6%. Credit card penetration has risen from 14.58% a decade ago to 17.19% as of March 31, 2017 a jump of 17.9%.
Save Time. Improve Performance.
NCUA and FDIC data is right at your fingertips. Examine national and market trends, build displays, filter data, track performance, and more with Callahan’s Peer-to-Peer analytics.

Credit unions would do well to continue practicing the credit union difference. Also, market, advertise, and generally get the word out about what that difference means to members and potential members now and in the future. The more they use the credit union, the more the credit union can benefit them.
And the numbers show it works. The movement is doing more good for more people. Lately, the buzzword for that relationship is the double bottom line. But we can also just stick with people helping people.
This article appeared originally on Credit Union Times in August 2017.
The Virtuous Circle Of Lower Fees And Higher Income
Top-Level Takeaways
The dependence on ATM, courtesy pay, and other checking fees among U.S. credit unions has tapered as fee income as a percentage of total assets has fallen sharply in the past decade.
A bump in two other measures of engagement checking accounts and credit card accounts suggests more members are making a credit union their primary financial institution.
The margin between interest rates for deposits and loans remains near historic lows, and the need for credit unions to develop alternative sources of income has not diminished.
What has tapered, however, is the dependence on the least consumer-friendly sources of revenue items like ATM fees, courtesy pay, and other checking account fees that fall under the label of non-interest income (NII).
To be sure, interest from loans remains by far the most important part of a credit union’s income stream. That’s not surprising considering credit unions exist to extend credit. That’s where credit unions build relationships and help members get to work, own a home, and educate themselves and their children.ContentMiddleAd
Indeed, interest income, which includes the smaller component of income from investments, makes up approximately two-thirds of all credit union income, in this case $1.4 billion annualized in the first quarter of 2017 compared with $728.6 million for NII, according to data from Callahan & Associates.
That proportion hasn’t changed much. Nor has another key measure of the importance of NII. As a percentage of average assets, NII was 1.30% in the first quarter of 2008. At the same point this year, it was 1.26%, a drop of only 4 basis points. (Its largest spike was to 1.44% in second quarter 2009 as the loan portfolio contracted in the height of the financial crisis.)
However, and this a big however, fee income as a percentage of total credit union assets has fallen sharply in the past decade, from 0.83% in first quarter 2008 to 0.60% in first quarter 2017. That’s 23 basis points, but it’s also 25% less dependence on punitive fees.
Click the tabs below to examine industrywide financial performance. Click on the graphs to view them in Peer-to-Peer.
Credit Card Penetration
Fee Income/ Average Assets
Income Comparison
Non-Interest Income/ Average Assets
Other Income/ Average Assets
Share Draft Penetration
5-Year Net Interest Income CAGR Leaders
5-YEAR NET INTEREST INCOME CAGR LEADERS
FOR US CREDIT UNIONS | DATA AS OF 03.31.17
© Callahan & Associates | www.creditunions.com
Source: Callahan & Associates.
2017 Callahan & Associates, Inc. All rights reserved
5-Year Non-Interest Income CAGR Leaders
5-YEAR NON-INTEREST INCOME CAGR LEADERS
FOR US CREDIT UNIONS | DATA AS OF 03.31.17
© Callahan & Associates | www.creditunions.com
Source: Callahan & Associates.
2017 Callahan & Associates, Inc. All rights reserved
Meanwhile, what has gone up sharply is other income a category that includes such items as GAP insurance, gains from mortgage sales, loan participations, and debit and credit interchange income.
During the same decade that fee income fell by 23 basis points, other income rose 19 basis points, from 0.47% in first quarter 2008 to 0.66% in first quarter 2017 as a percentage of total assets, Callahan data shows.
So, what do all these numbers mean? Credit unions have been enlarging a virtuous circle of growth. They offer lower fees. American consumers attracted by lower fees and rates have increased their business with credit unions by making financial cooperatives their primary financial institution (PFI). In return, credit unions continue to offer even better fees and rates.
We see the bump in standing as a PFI in two other measures of engagement. Checking accounts are a prime indicator of an institution’s status as the PFI, and credit card accounts are a viable measure, too.
Share draft penetration went from 46.46% in first quarter 2008 to 56.49% in first quarter 2017. That’s a robust increase of 21.6%. Credit card penetration has risen from 14.58% a decade ago to 17.19% as of March 31, 2017 a jump of 17.9%.
Save Time. Improve Performance.
NCUA and FDIC data is right at your fingertips. Examine national and market trends, build displays, filter data, track performance, and more with Callahan’s Peer-to-Peer analytics.
Credit unions would do well to continue practicing the credit union difference. Also, market, advertise, and generally get the word out about what that difference means to members and potential members now and in the future. The more they use the credit union, the more the credit union can benefit them.
And the numbers show it works. The movement is doing more good for more people. Lately, the buzzword for that relationship is the double bottom line. But we can also just stick with people helping people.
This article appeared originally on Credit Union Times in August 2017.
Daily Dose Of Industry Insights
Stay informed, inspired, and connected with the latest trends and best practices in the credit union industry by subscribing to the free CreditUnions.com newsletter.
Share this Post
Latest Articles
Markets React To Consequential Announcements
Meet The Finalists For The 2026 Innovation Series: Data And Decision Intelligence
A New Product Playbook Is Driving Change At Premier Credit Union
Keep Reading
Related Posts
Markets React To Consequential Announcements
Financial Nihilism Is Real, But How Can Credit Unions Respond?
2026 Begins With Market Sentiment Similar To 2025
Markets React To Consequential Announcements
Jason HaleyA Small Match Builds Big Emergency Savings At Lake Trust
Aaron PassmanDon’t Wait For Data. FirstLook Analysis Is Available Today.
Callahan & AssociatesView all posts in:
More on: