The credit union movement is hitting new highs in first mortgage market share and originations, and it’s increasingly sharing the wealth in a most credit union-y way.
That’s because loan participations are clearly on the rise while sales into the secondary market remain dominant but relatively flat among America’s member-owned financial cooperatives.
As we reported in our second quarter Trendwatch, first mortgage market share rose 90 basis points year over year to 8.2%. Just more than a third 33.8% of that $134.4 billion in originations year-to-date have been sold into the secondary market. Five years ago, that was 50.4% of $112.5 billion in first mortgage originations sold off in the first six months. ContentMiddleAd
PERCENT OF YTD MORTGAGE ORIGINATIONS SOLD TO SECONDARY MARKET
FOR ALL U.S. CREDIT UNIONS | DATA AS OF 06.30.17
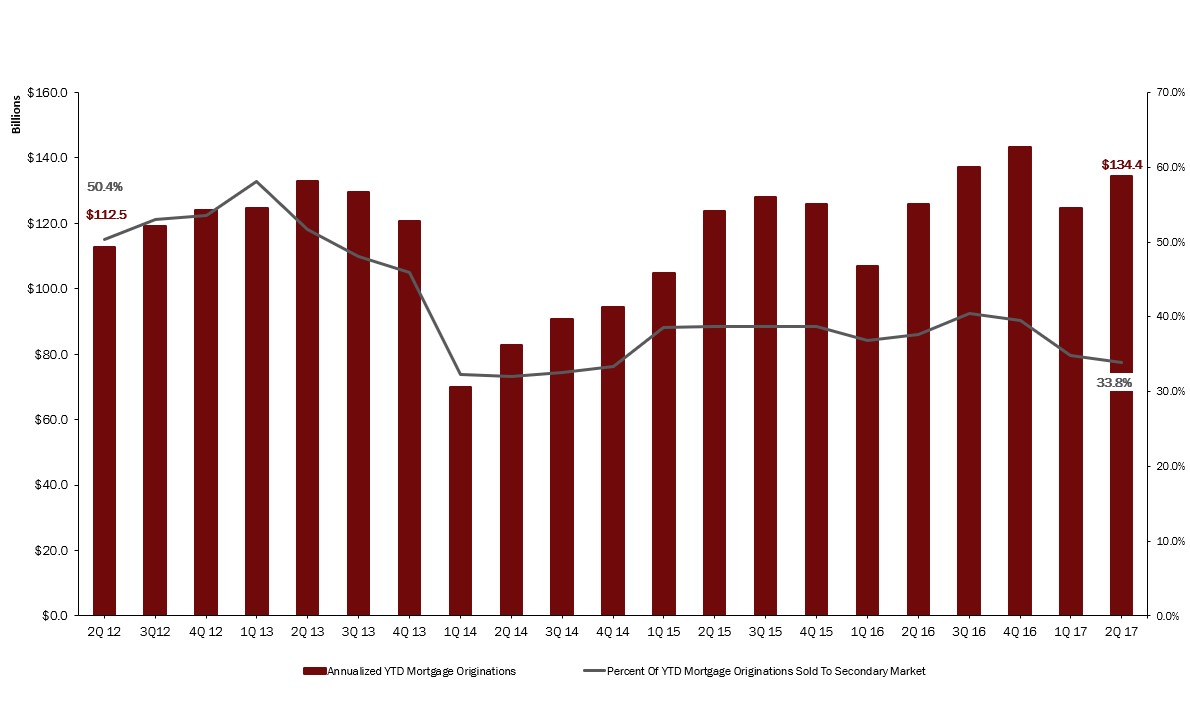
While mortgage volume has risen, the percentage of mortgage originations that credit unions sell to the secondary market has steadily declined in the past five years.
Source: Callahan & Associates.
Meanwhile, on June 30, 2012, U.S. credit unions had $2.5 billion in outstanding sold participation loans and $10.7 billion in purchased participation loans outstanding. Five years later, those numbers have risen sharply to $6.0B and $26.4 billion, respectively.
PARTICIPATIONS PURCHASED AND SOLD AS A PERCENTAGE OF TOTAL LOANS
FOR ALL U.S. CREDIT UNIONS | DATA AS OF 06.30.17
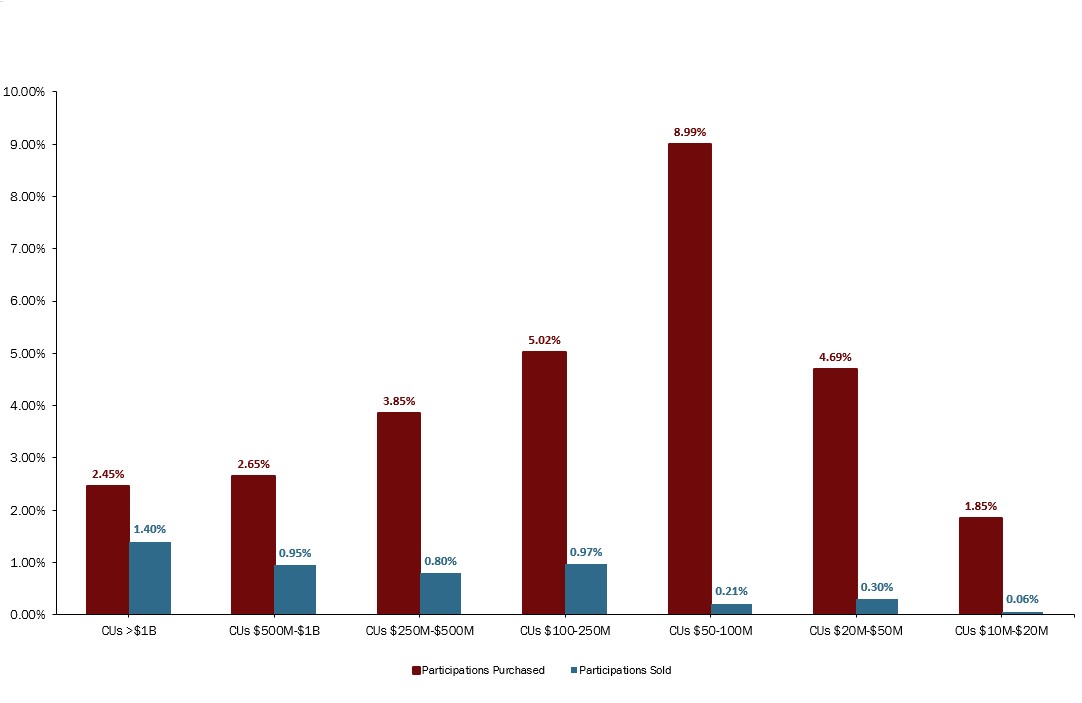
Credit unions in the $50 million to $100 million asset range have been particularly active buyers of participation loans, representing 8.99% of their total loans in the second quarter.
Source: Callahan & Associates.
We see a few drivers here. One is rising interest rates of late boosting the popularity of ARMs and hybrid/balloon notes, which credit unions may prefer to hold or sell into participations rather than meet the requirements for selling those to Fannie Mae or Freddie Mac.
FIRST MORTGAGE BREAKDOWN
FOR ALL U.S. CREDIT UNIONS | DATA AS OF 06.30.17
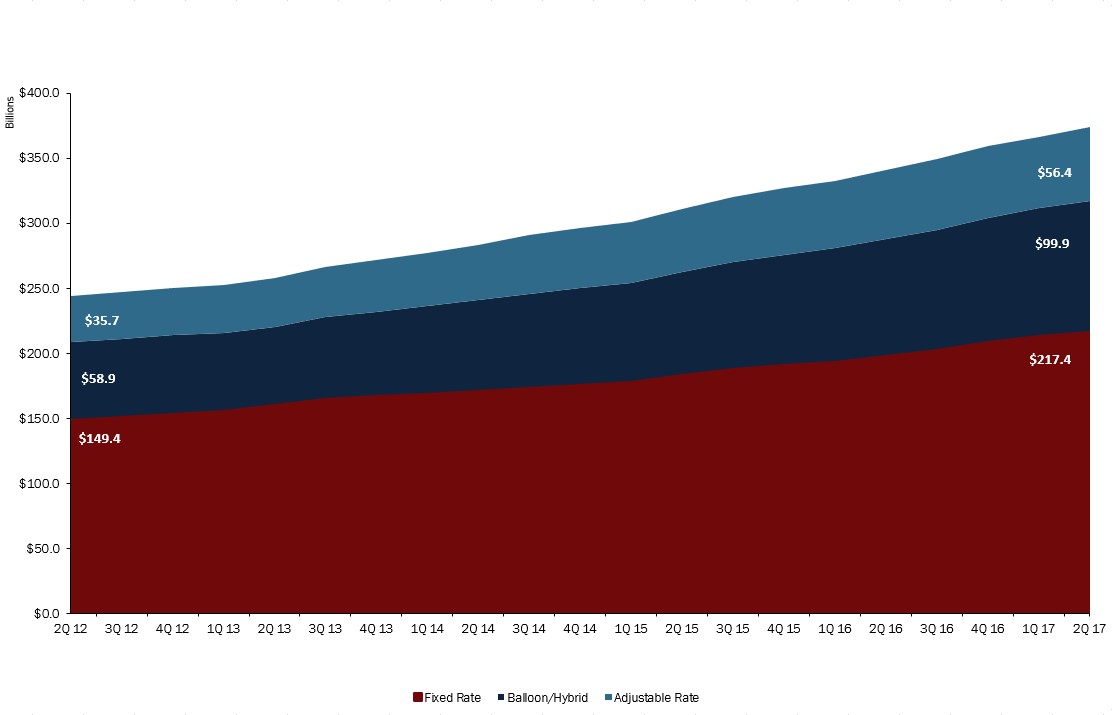
Fixed-rate notes still dominate, but balloon/hybrid and adjustable rate mortgages have also risen in equal proportions in the past five years.
Source: Callahan & Associates.
Another is that success in selling first mortgages is outstripping the capacity for some credit unions to handle all that servicing. That might be part of the reason that the 754 credit unions in the $50 million to $100 million asset band have the highest percentage of their portfolio sold off as participations. They’re big enough to aggressively market and manage the mortgage sales process but may not have the scale to service it, or the appetite and capacity for the accompanying interest rate risk.
And then, there’s diversification of the loan portfolio, another way to help dampen interest and delinquency risk.
LOAN-TO-SHARE RATIO
FOR ALL U.S. CREDIT UNIONS | DATA AS OF 06.30.17

The loan-to-share ratios for credit unions by asset class creates a stepladder down in this bar chart using second quarter 2017 data in the Callahan & Associates database.
Source: Callahan & Associates.
Of course, that’s true in different degrees in all asset classes and no two credit unions are exactly like. There’s also this: Many credit unions have always liked to work with other credit unions when they can, in this case helping to raise liquidity for themselves while providing much-needed earning assets for the participation buyers.
No matter the motivation, or combination of them, while originations were hitting an all-time high in the second quarter, fixed-rate mortgages were accounting for 58.2% of the $373.7 billion in new notes year-to-date, compared with 61.2% for the $244 billion generated in the same period of 2012. Balloons and hybrids accounted for 26.7% of 2017 year-to-date originations, up from 24.1% five years ago, and ARMs got 15.1%, compared with 14.6% in the first six months of 2012.
Another Perspective On Your Mortgage Lending Performance
Comparing your mortgage lending performance against peers provides context to your numbers. Callahan’s analytics software lets you do it within minutes.

Taken in one five-year chunk, we can see that credit unions originated $373.7 billion in the first six months of 2017, up 53.1% from $244 billion in the same time frame five years ago. The growth leader again is balloons/hybrids, which jumped 69.6%, followed by ARMs at 58% and fixed rates at 45.5%.
Meanwhile, second quarter 2017 data from Callahan & Associates shows a stairstep correlation between asset size peer groups and loan-to-share ratios. The highest was 81.71% among the 284 financial cooperatives of more than $1 billion in assets while the lowest was 53.77% for the 759 that were between $10 million and $20 million in assets at mid-year.
So, we’ll just have to see if the smaller credit unions will try to ramp up loan growth with all that liquidity. And even among all asset classes, there’s room to grow, and loans to share.
Liz Furman is a Senior Industry Analyst at Callahan & Associates. She can be contacted at 202-223-3920 or efurman@callahan.com.
This article appeared originally in the Credit Union Times in September 2017.