Credit unions posted notable growth in the first quarter of 2017 in three major metrics. Loan growth was in the double-digits, 10.9%, for the 11th consecutive quarter. Share growth was at 8.6%, the fastest first quarter rate since 2003, and member growth was at 4.4%, the fastest first quarter rate since 2002.
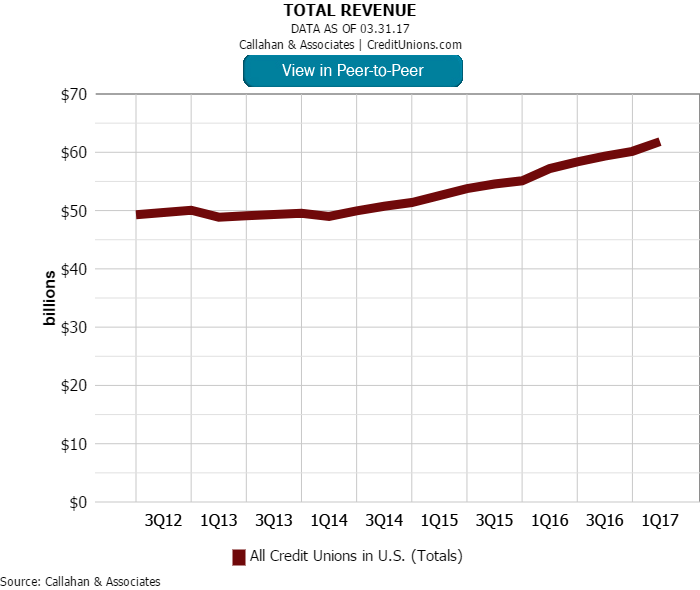
As members turn to credit unions to serve as a primary financial institution, member relationships deepen and revenue opportunities expand. In fact, total revenue, which has been on a positive trajectory since 2014, reached $61.8 billion as of March 31,according to data by Callahan & Associates for 99.1% of industry assets.
What is the primary revenue driver at America’s credit unions? Interest income, which comprised 73.1% of total revenue in first quarter 2017. The industry’s success in lending underpinned the 8.8% year-over-year growth posted by credit unions.
How Do You Compare?
Discover how your credit union stacks up against industry averages, peer groups, and other credit unions using the metrics from this article. With Callahan Analytics, deeper insight is just a click away.

Non-interest income (NII) accounts for a smaller proportion of total income, but it is the revenue focal point for many credit unions. There are numerous sources of NII, so credit unions have flexible revenue opportunities to improve their bottom lines.
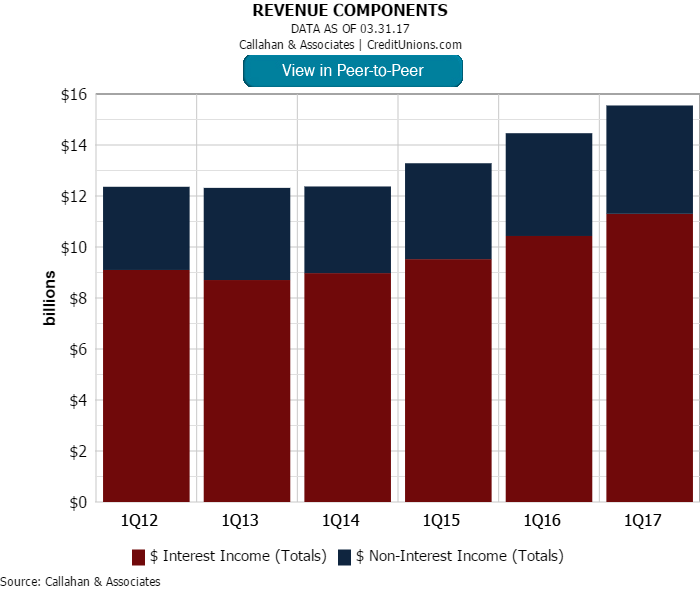
Investment income and loan interest are the key drivers behind interest income.
Investment income grew 12.2% year-over-year and surpassed $1.3 billion. Credit unions have posted annual growth in total investments for three of the past four quarters. At $390.6 billion, first quarter investment balances were at a level not seen since2013 and 2014.
Riding the lending wave, loan income expanded 7.6% year-over-year and neared the $10 billion mark in the first quarter of 2017. Callahan expects total loans to surpass $900 billion in the second quarter of this year, which is a good sign for income generation.
On the other side of the coin, fee income and other operating income are the key drivers of non-interest income.
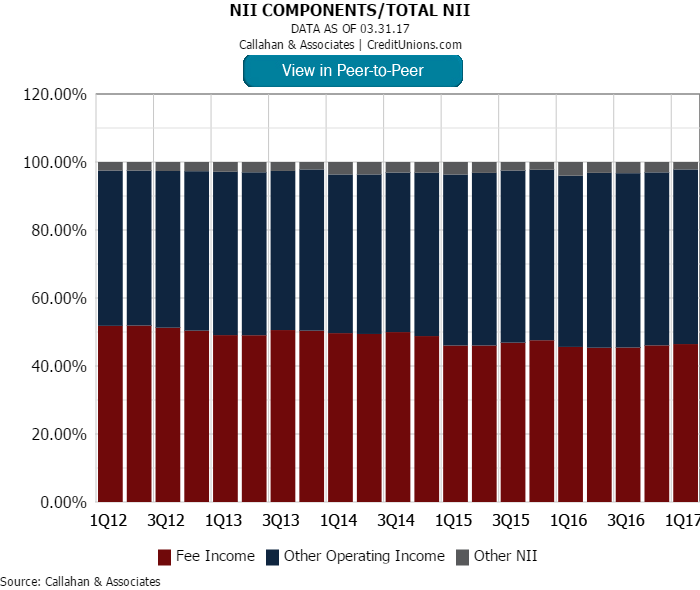
Fee income historically comprised a larger proportion of total non-interest income until 2015, when the composition shifted in favor of other operating income. Other operating income accounted for 51.4% of non-interest income as of first quarter 2017,whereas fee income accounted for 46.5%. Other sources, such as gain (loss) on investments, non-trading derivatives, and disposition of fixed assets for example, accounted for the remaining amount.
These non-interest income line items on the 5300 Call Report consist of a diverse set of contributing sources. Fee income generally falls into categories related to deposits, loans, or other member services. Loan-related examples can include late charges,skip payment fees, and loan application fees. Examples of other member services include check cashing and safety deposit box fees.
Sources of deposit-related fee income:
- Minimum balance/maintenance
- NSF/courtesy pay
- Stop payment
- ATM surcharge and interchange income
- Wire transfers
- ACH
- Returned check
- Money order/travelers checks
Sources of other operating income:
- Unconsolidated CUSO income
- Debit, credit, and prepaid card interchange income
- Loan servicing
- Mortgage sales
- Investment and insurance sales
In a 2016 Callahan survey of 170 credit unions, the largest reported sources of non-interest income from the lists above were:
- Debit card interchange and fees
- Checking and savings, including non-sufficient funds and courtesy pay income
- Credit card interchange and fees
- Mortgage sales, servicing rights, and real estate lending fees.
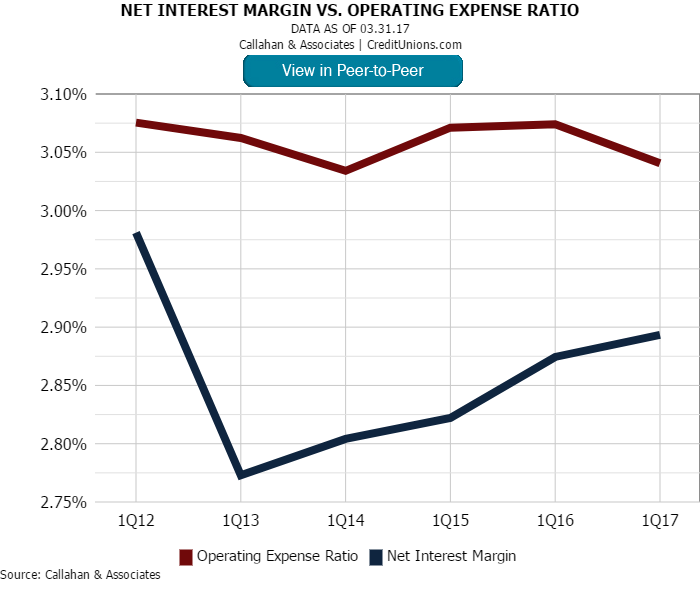
The spread between the net interest margin and the operating expense ratio has narrowed from 30 basis points in the first quarter of 2013 to 15 basis points as of the first quarter of 2017. Historically, the credit union business model has enabled cooperativesto cover operating expenses with interest income alone. However, a persistent low rate environment combined with other competitive pressures means interest income alone does not cover an institution’s operating expenses in totality. Thus, theneed for NII has emerged.
As margins continue to tighten, credit unions must leverage both interest and non-interest income sources while remaining operationally efficient to sustain competitiveness in the marketplace.