Total borrowings in the credit union industry increased 11.7% year-over-year to total $53.9 billion as of June 30, 2018. This marks the highest second quarter growth rate since 2015, when it was 26.7%. Borrowings have now increased in the second quarter for seven consecutive years.
Total borrowings have increased 54.8% over the past five years, jumping from $34.8 billion in the second quarter of 2014 to $53.9 billion as of midyear 2018. With assets growing at a slower rate of 5.9%, the borrowings-to-assets ratio increased 20 basis points over the past year to 3.73%. This is the highest ratio recorded by the industry in the second quarter since 2015, when it was also 3.73%.
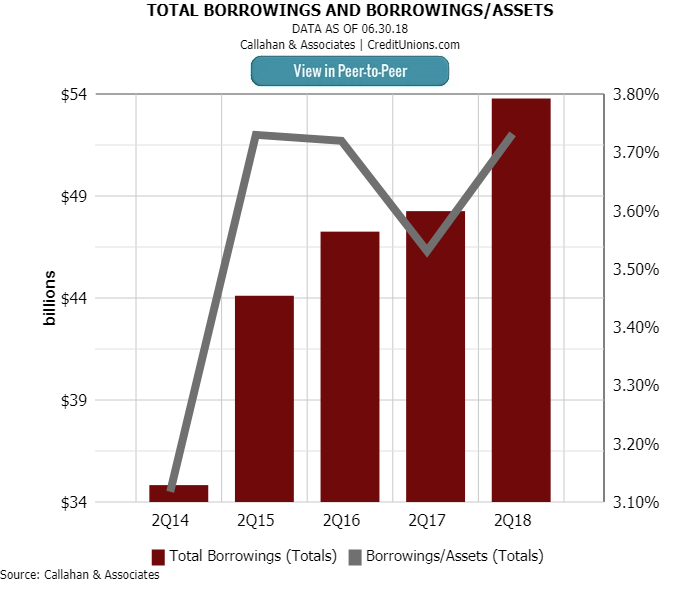
Over the past five years, borrowings to assets has increased 61 basis points from 3.12% in 2014 to 3.73% in 2018.
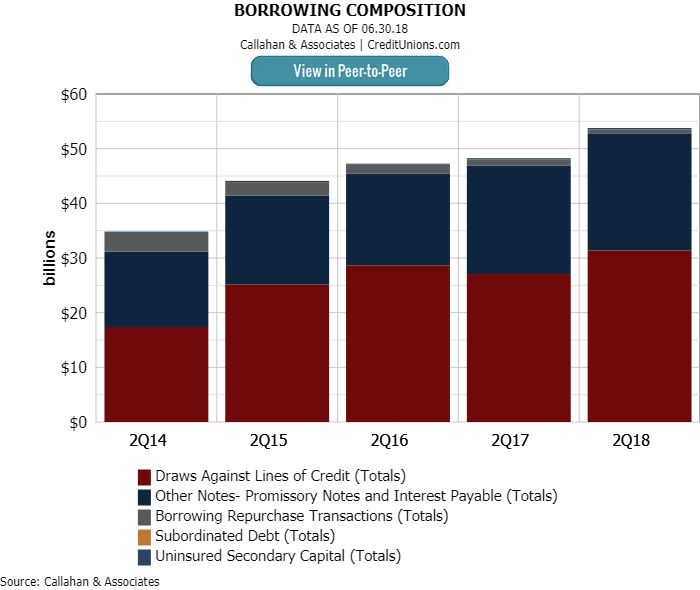
The composition of borrowings has also evolved over the past few years. At 58.4% of total borrowings, or $31.5 billion, draws against lines of credit have made up more than half of the portfolio for the past 16 quarters. The remainder of credit union debt comprised other notes, repurchase transactions, subordinate debt, and secondary capital. ContentMiddleAd
Other notes, which include borrowings from the Federal Reserve Bank Discount Window, borrowings from other agencies, and installment loans from corporate credit unions, comprised 39.6%, or $21.3 billion, of the portfolio, the second-largest borrowings segment. The other three components (repurchase transactions, subordinate debt, and secondary capital) shared the remaining 2.1% of the portfolio.
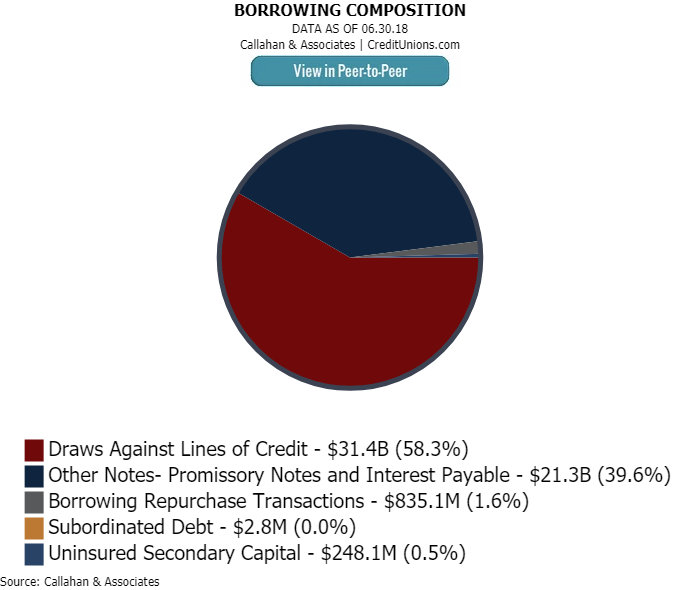
Draws against lines of credit made up more than half, 58.4%, of the credit union portfolio in the second quarter of 2018.
The data in this article is pulled from Callahan’s Peer-to-Peer. Callahan Analytics can help your credit union benchmark performance. Learn how today.
Uninsured secondary capital was up 34.7% year-over-year to $248.1 million as of June 30, 2018, and was the fastest-growing component, followed by draws against lines of credit, which were up 16.3%, or $4.4 billion, to $31.5 billion.
Credit unions reported year-over-year decreases in two components. Borrowing repurchase transactions were down $292.4 million, and subordinate debt was down $7.7 million. These two made up a collective 1.6% of the borrowings portfolio.
The industry’s borrowings totaled $53.9 billion as of June 30, 2018. That was up $5.7 billion year-over-year.