Credit union CFOs have a complex, highly demanding job. In addition to managing their own daily tasks and the credit union’s performance they often must educate C-suite executives and other employees who do not have the level of financial acumen required of a CFO. Often, they must show credit union staff members how to analyze and interpret various financial benchmarks and metrics. The following benchmarks are ones that CFOs use daily. Combined with easy-to-understand outlines and descriptions, this week’s Graphic Of The Week makes a great primer for nonfinancial employees.
Efficiency Ratio
How It’s Calculated: The efficiency ratio is calculated by dividing a credit union’s operating expenses by interest income less interest expenses plus non-interest income.
Operating Expenses
__________________________
Interest Income – Interest Expenses + NII
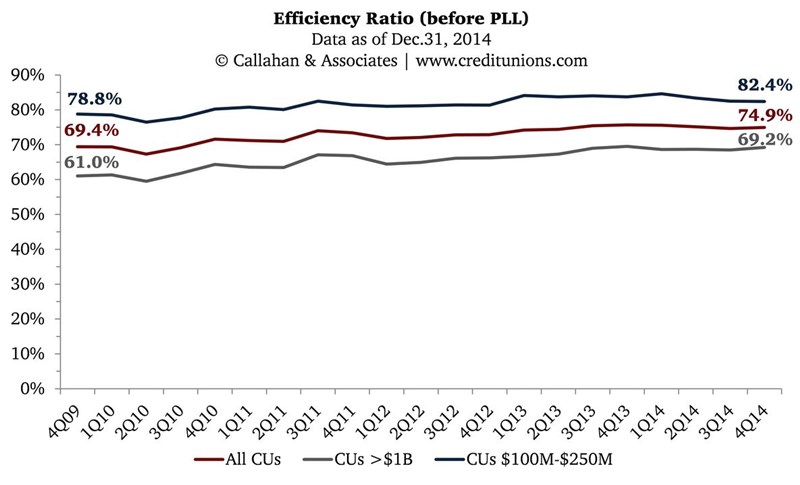
Source: Callahan & Associates’ Peer-to-Peer Analytics
In general terms, the efficiency ratio measures how much the credit union spends to create $1 of revenue.Typically, a lower efficiency ratio is desirable, as long as it doesn’t come at the expense of member service. A high or rising efficiency ratio means the credit union is losing a larger share of its income to overhead expenses. A low efficiency ratio means operating expenses are a smaller percentage of income.The efficiency ratio can fluctuate over time, influenced by the interest rate environment, as income is generally more sensitive to changes in interest rates than are expenses. In theory, credit unions with higher ratios of fee income to total income should see less fluctuation in the efficiency ratio than credit unions with little fee income.
Non-Interest Income/Average Assets
How It’s Calculated: This measure is calculated by dividing the sum of annualized fee and other operating income by average total assets.
Annualized Fee Income + Annualized Other Operating Income
________________________________
Average Total Assets
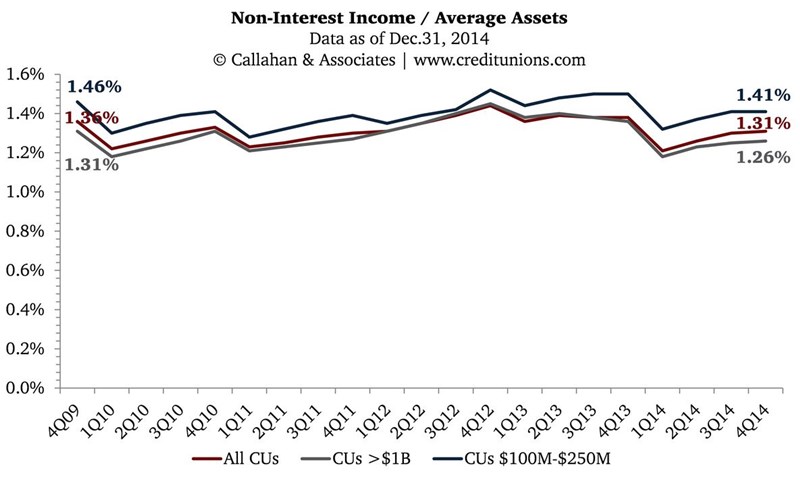
Source: Callahan & Associates’Peer-to-Peer Analytics
This ratio measures the amount of non-interest income the credit union generates as a percentage of average assets. The higher the number, the more income the credit union is generating through sources other than asset-based products.Analyzing non-interest income as a percentage of assets removes the variations that exist when comparing the ratio to total income because viewing NII through a total-assets lens removes the impact of a weak loan-to-asset ratio. Non-interest income factors that impact the ratio generally fall into two major categories: (1) income generated directly from the member in the form of fees; (2) income generated indirectly from members or other aspects of the credit union’s operations, such as interchange income from credit and check cards or income from CUSO activity. The rate of asset growth is the most impactful variable on the ratio, although strategies for non-interest income play a part as well. Rapid asset growth will depress the ratio while slow or stagnant asset growth will inflate the ratio.
Return On Assets
How It’s Calculated: Return on assets (ROA) is calculated by dividing annualized net income by average total assets.
Annualized Net Income
_________________
Average Total Assets
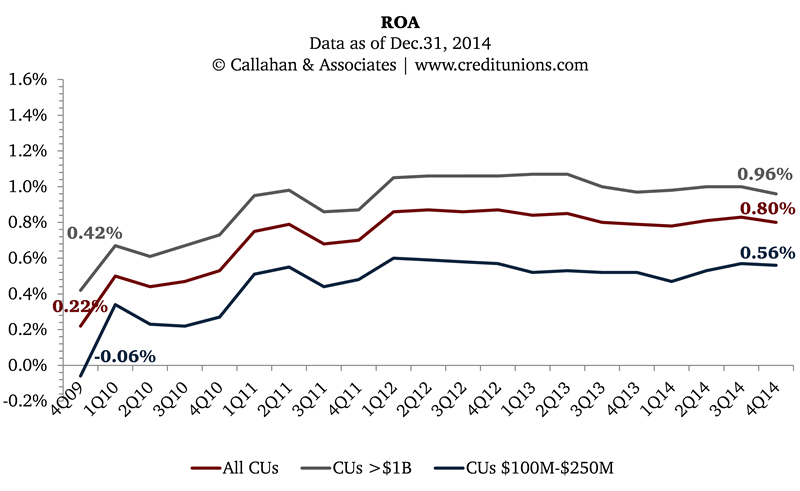
Source: Callahan & Associates’Peer-to-Peer Analytics
ROA is an important gauge of a credit union’s profitability. It shows how efficiently management is running the credit union by revealing how much income is generated for each dollar of assets deployed. In general, a high ROA relative to peers reflects management’s success at using assets to generate income. Credit unions; however, should view ROA in light of their institutio’s distinct strategy. For example, if a credit union passes along potential profits to members through low fees or high deposit rates and low lending rates, then its strategy might result in a lower ROA relative to its peers.
Cost of Funds
How It’s Calculated: Cost of funds is calculated as the dividends paid to members or interest paid on borrowed money, divided by the average outstanding shares and borrowings.
(Share Dividends + Deposit Interest + Interest On Borrowed Money)
_______________________________________________________
( Total Shares ($) + Total Borrowings ($))
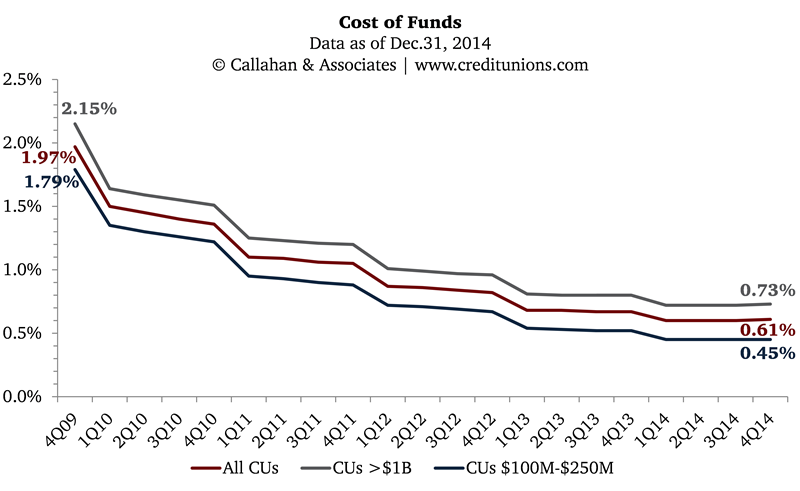
Source: Callahan & Associates’Peer-to-Peer Analytics
A credit union’s cost of funds is influenced externally by the overall rate environment and internally by the makeup of the deposit portfolio. For example, older members might have more CDs, or a more affluent membership might have higher balances on tier-priced products. Both situations will increase the cost of funds. Credit unions with high checking account penetration will generally have lower cost of funds. When interpreting the cost of funds, it’s easy to think about it as how much the credit union must pay in interest for every dollar of shares or borrowings it receives.
You Might Also Enjoy
- 5 Ratios Every CEO Must Know
- 3 Ratios Every COO Must Know
- 4 Ratios Every HR Professional Should Know
- 5 Ratios Every CLO Should Know