Today, credit unions have two primary ways of reviewing a loan application: 1) manually via traditional human review, and 2) using machine technology, commonly known as automated decisioning. Many credit unions, large and small, are wary of a change to implement automated decisioning. Larger credit unions tend to be more inclined to engage such technology, while adoption rates at smaller institutions are much lower, for a number of potential reasons which we will address below.
In a survey earlier this year Callahan Associates follows up on a 2016 Callahan study regarding the changing lending strategies surrounding automated-decisioning and loan origination systems (LOS). The lending portfolio has continued its exceptional growth and automated decisioning remains at the forefront of innovation in this area.
The U.S. credit union industry saw year-over-year loan growth at 9.7% as of March 2018. This marked the end of 14 consecutive quarters of double-digit annual loan growth. In the past five years, the loan portfolio has expanded 61.8% and balances have topped $982.5 billion.
ContentMiddleAd
Consumer loans have been the driving factor in overall loan growth, up 20.2% from March 2017 to March 2018. With double digit-annual growth for the past 18 quarters, consumer loans have increased 93.7% in the past five years and first quarter 2018 balances now exceed $487.0 billion for the industry.
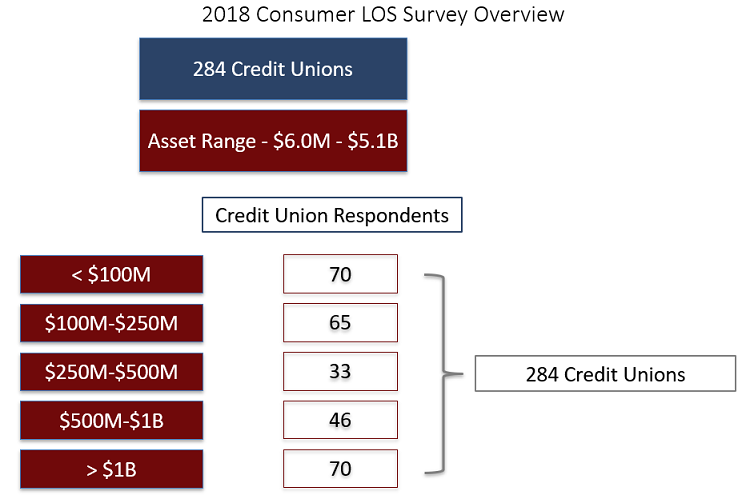
To develop a more thorough understanding of how credit unions are changing their automated decisioning practices amidst the rapid loan growth across the industry, Callahan refreshed the data by administering another survey to participating credit unions in the first quarter of 2018. In total, 284 credit unions of different asset sizes responded to the survey with valuable insights on automated decisioning.
Overall, 195 of the respondents reported using automated decisioning for consumer lending while 89 did not. Below are our takeaways from this year’s study.
Insight 1: Does asset size affect whether a credit union uses automated decisioning when originating consumer loans?
Answer: Yes
When analyzing asset bands, there is a positive correlation between asset size and the usage of a loan origination system (LOS) for automated decisioning. Only 22.9% of respondents at credit unions below $100 million in assets use automated decisioning. Comparatively, 95.7% of credit unions over $1 billion in assets implement automated decisioning. In fact, the only asset class to have less than 50% of their credit unions using auto-decisioning for consumer loans were credit unions below $100 million in assets.
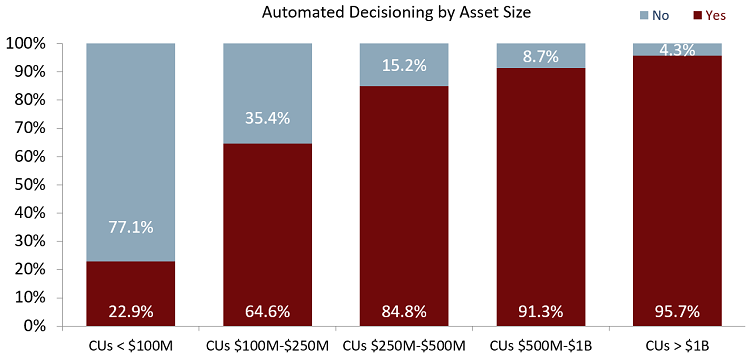
Cost and personnel constraints at smaller credit unions to research, review, and properly implement effective loan origination systems seem the main reasons for their lack of use. As the asset size increases, there is a plateau effect where LOS implementation increases tremendously at smaller asset classes and increases by smaller amounts at larger asset classes. However, there are still credit unions of varying sizes that do and do not implement automated decisioning for different reasons including control, cost, impersonality, and more.
Insight 2: What percent of loans are auto approved or denied versus manually approved or denied?
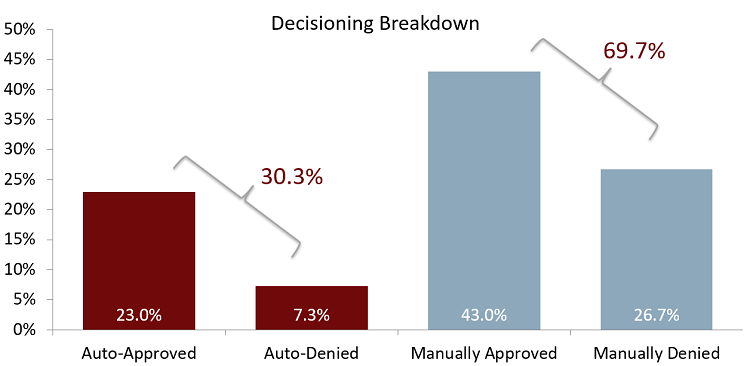
Answer: 30.3% of loans are auto approved or denied
Credit unions continue to manually review the majority of their consumer loans according to data collected in the survey. Of the credit unions who responded, on average 69.7% of their loans were reviewed manually and 30.3% reviewed automatically. The composition of automatically decisioned loans were 23.0% auto-approved and 7.3% auto-denied, which equates to a 76.0% approve and 24.0% deny rate within auto-decisioning.
*For a large part of the remaining analysis, the median and the middle 50% distributions are used rather than pure averages. With a relatively small sample size, this helps account for outliers in the data that can heavily skew the results.
Insight 3: Does automated decisioning negatively affect consumer loan asset quality?
Answer: No
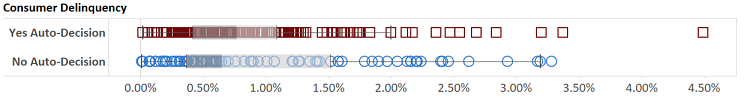
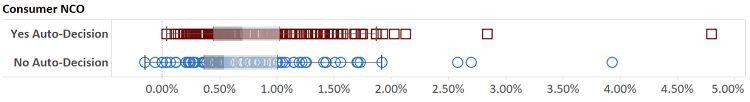
The median consumer loan delinquency for credit unions that use automated decisioning was 0.77%. This was 12 basis points higher than the respondents who did not use automated decisioning. At first glance, it appears that credit unions who auto-decision have higher delinquency rates. The whisker box plot highlights the middle 50% distribution of respondents. The middle 50% delinquency distribution for credit unions who utilize auto-decisioning ranges from 0.42% to 1.07%. Comparatively, those who manually reviewed all their loans had a middle 50% delinquency range from 0.37% to 1.52%. Although credit unions with automated decisioning have a higher average delinquency rate, the middle 50% delinquency distribution highlights how the group of credit unions that do auto-decision is both lower and both concentrated than those that do not.
The median net charge-off rates for credit unions that use automated-decisioning software was 0.70%, 16 basis points higher than those who did not. Again, the middle 50% net charge-off distribution for credit unions that use automated decisioning is tighter than those who do not, however the upper band of this range is higher than those that do not. Interestingly, of the respondents, credit unions in the largest asset class (over $1 billion) and the smallest asset class (under $100 million) were the only asset classes that posted higher net charge-off rates when using automated decisioning. The three asset classes that segment credit unions between $100 million and $1 billion all saw lower net charge-off rates for those institutions that use automated decisioning.
Insight 4: Why do credit unions not implement automated decisioning?
Answer: 1. Control 2. Cost
Lack of control related to the loans being originated was the leading reason for why a credit union does not use automated decisioning in its consumer loan portfolio. This accounted for 19.5% of the respondents who do not use automated decisioning. In the 2016 survey, the leading cause for not implementing automated decisioning was the impersonal nature of an LOS. In the 2018 survey this was the fifth leading cause for not implementing automated decisioning.
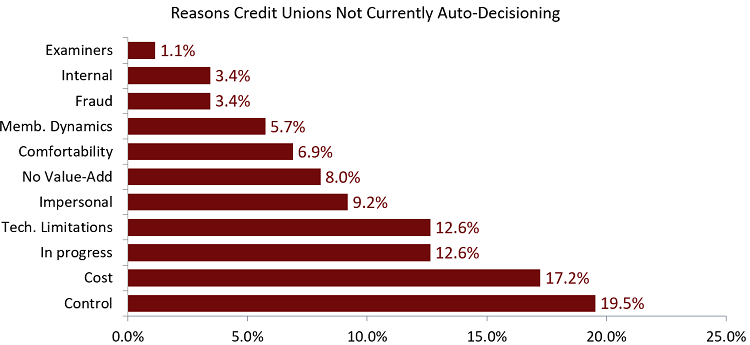
The second most frequent answer was the cost of the system. Implementing an LOS capable of automated decisioning can be costly; smaller credit unions specifically cited this as an area of concern. Larger credit unions often have more financial freedom due to scale, evidenced by the increased participation in automated decisioning at larger institutions.
Insight 5: Is there a relationship between automated decisioning and:
-
Consumer loan origination growth?
-
Efficiency?
-
Loan-to-share ratio?
1. Answer: Yes
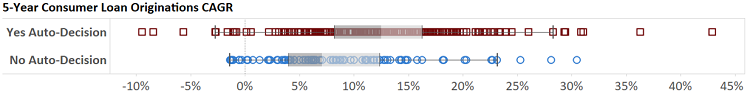
The median five-year consumer loan origination compounded annual growth rate (CAGR) was 12.5% for credit unions that used automated decisioning, compared to the 7.1% CAGR for credit unions who do not use an LOS. The middle 50% distribution for loan origination CAGRs tell the same story. Credit unions that auto-decision saw a 50% distribution range from 8.2% to 16.3% while those that do not have a lower distribution from 4.1% to 12.4%.
Looking at the consumer loan CAGRs by asset class shows that the performance benefits of auto-decisioning are skewed toward larger institutions. Credit unions above $500 million found significant benefits from using an LOS that allows auto-decisioning. Particularly, at 13.9%, credit unions with $500 million to $1 billion in assets who use auto-decisioning have a consumer loan CAGR 6.3 percentage points greater than those who do not.
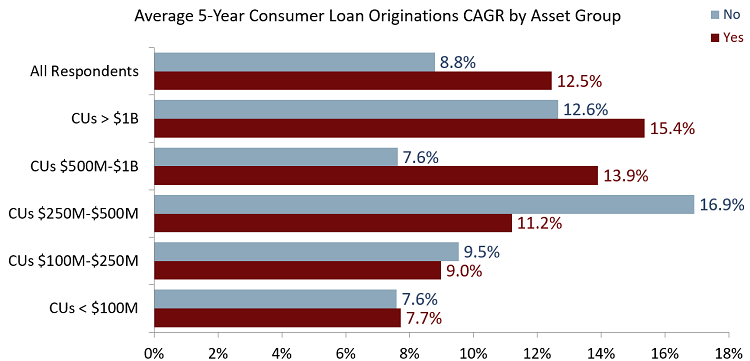
Credit unions with assets below $250 million saw roughly equal consumer loan CAGRs between credit unions which auto-decision and those that do not. This further supports the idea that the larger credit unions are finding more value in this feature than smaller institutions.
2. Answer: Potentially
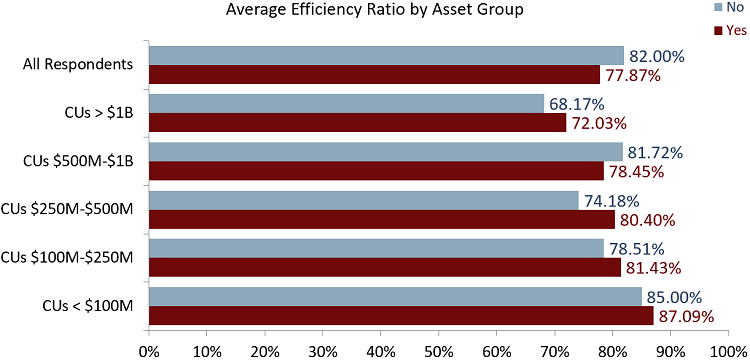
The efficiency ratio is calculated by dividing non-interest expense (operating expense) by net interest income, fee income and other operating income. Essentially, it translates to what a credit union pays in overhead expenses to generate one dollar of income; a lower efficiency ratio is better.
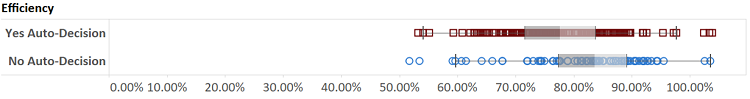
The median efficiency ratio for credit unions that use automated decisioning software was 77.6% in the 2018 survey. Comparatively, credit unions who reviewed all their loans manually had a median efficiency ratio of 83.6%. The middle 50% distribution for credit unions which auto-decision was much tighter, ranging from 71.7% to 83.8% compared to those that do not, which varied from 71.4% to 89.2%.
These numbers are in line with the theory behind automated decisioning. Fundamentally, paying for a software system would be far less than the overhead associated with paying salaries and other associated costs with manual reviewing, which theoretically should lead to lower efficiency.
When segmenting the data by asset bands, the picture becomes less clear. Credit unions with assets between $500 million and $1 billion were the only group to see a lower efficiency ratio when implementing automated decisioning. Credit unions above $1 billion had the lowest efficiency ratio for both credit unions with and without automated decisioning. This is likely due to economies of scale, where larger credit unions can leverage size to streamline expenses far more easily and create efficiencies.
One potential explanation for the counterintuitive ratio results is that smaller credit unions may have seen a higher efficiency ratio due to a spike in operating expenses due to the implementation of the LOS. If this were the case, one would hope the ratio could be expected to decline in subsequent years as the maintenance cost of an automated system is less than that of the costs associated with a manual review process. Recall, cost was the second most frequent answer when asking why credit unions had not implemented an LOS.
3. Answer: Yes
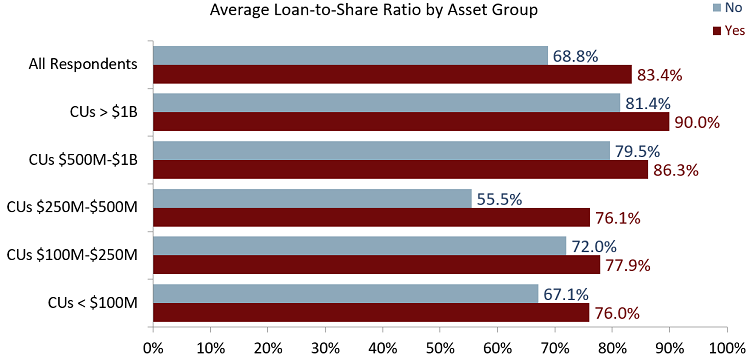
The loan-to-share ratio shows how efficiently credit unions are using their balance sheet. It is simply calculated by dividing loan balances by share balances.
The median loan-to-share ratio at credit unions implementing auto-decisioning was 86.8%, 16.2 percentage points greater than those that do not. Additionally, the middle 50% loan-to-share distribution for these credit unions is also higher, ranging from 73.6% to 96.1%. This is expected as an automated decisioning process allows for much more efficient loan review and subsequent origination.
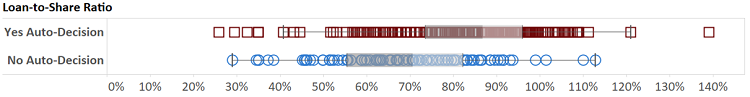
This trend held true across all asset bands; an auto-decisioning program will likely increase a credit union’s loan-to-share ratio. Larger credit unions typically have a higher loan-to-share ratio as they are less risk averse.
Insight 6: How often do credit unions evaluate their consumer decisioning criteria?
Answer:
Respondents of the auto-decisioning survey evaluated their criteria at different intervals. The most frequent response was quarterly, consisting of 17.4% of the respondents. During the last survey, roughly 34% of responding credit unions evaluated their criteria annually, whereas in this iteration, the percent of institutions which review annually fell to 16.4%.. Semi-annually was the third most common evaluation period with 9.2% of respondents evaluating their criteria twice a year.
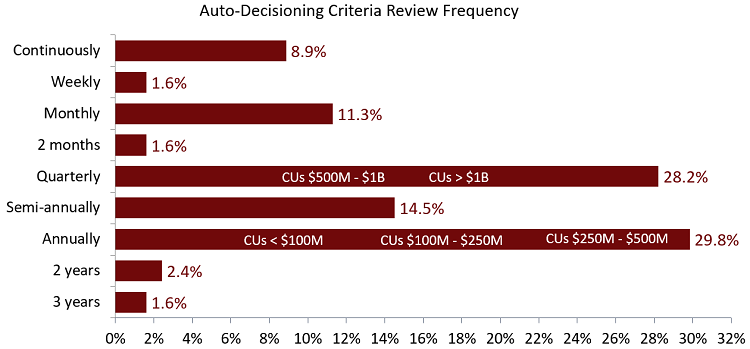
When segmented by asset size, quarterly was the most commonly cited review frequency for institutions greater than $500 million in assets. Credit unions with fewer than $500 million in assets reported annual criteria reviews to be most common, indicating that asset size and related resources play a role in criteria review frequency.
Insight 7: Who has the biggest market share in the loan origination systems?
Answer: MeridianLink
Again, MeridianLink is the favored LOS provider among our respondents. Still that accounts for only 21.0% of the credit unions who use automated decisioning. There are multiple other providers including Symitar and Fiserv, the two largest providers of core processing platforms in the credit union industry.