Top-Level Takeaways
-
CAP COM is using a data lake and new reporting tools to integrate and interpret member data for business units across the enterprise.
-
The effort began with a three-year plan and has kicked into high gear after integrating its data lake into a revamped core processing system.
CU QUICK FACTS
CAP COM FCU
Data as of 12.31.18
HQ: Albany, NY
ASSETS: $1.8B
MEMBERS: 127,820
BRANCHES: 11
12-MO SHARE GROWTH: 9.7%
12-MO LOAN GROWTH: 11.4%
ROA: 1.02%
CAP COM Federal Credit Union ($1.8B, Albany, NY) has embarked on a data aggregation and analytics journey, using a three-year roadmap to align staff and systems to better understand what it knows about members and how to maximize those relationships.
The Empire State cooperative is using OnApproach for its in-house data lake and Microsoft Power BI for data visualization and reporting. For reports that dont require visualization, the credit union is using SQL Server Reporting Services.
Johanna Robbins, CAP COMs senior vice president of finance and business intelligence, established the credit unions initial, high-level roadmap in 2017. Robbins and business intelligence analyst Mike Wiseman fleshed it out through 2018.
The journey will reach a critical point in March 2019 when CAP COM integrates OnApproach with the credit unions just-renovated Symitar Episys core processing system, providing access to a vast store of member transaction and personal data.
Here, Wiseman describes CAP COMs work in detail:
How did CAP COM begin its journey toward better business intelligence?

Mike Wiseman, Business Intelligence Analyst, CAP COM FCU
Mike Wiseman: We intentionally created the first version of the roadmap to be at a very high level as we worked to establish exactly what we wanted our BA/BI [business analytics/business intelligence] team to be and what role it was going to play in the organization.
Throughout the second half of 2017 and into the first part of 2018, the BA/BI team went to conferences and established relationships with other credit unions that were also on the data analytics journey, so we could learn about best practices, what works, and what doesnt.
We established a more structured plan in mid-2018. The initial focus is on the next 18 months; the longer three-year plan remains flexible to meet the changing needs of the credit union.

CAP COM is following this roadmap as it incorporates systems and staff into aggregating and analyzing its data stores. To view the enlarged version
Whats the credit unions intention for data aggregation and analysis?
MW: Were after data with a single source of truth that we can use to identify growth opportunities and make strategic decisions on products. We also want to standardize data and data definitions throughout the organization.
We then want to create personal experiences with our members, using the data to get a holistic view of our members and to better understand when and how they want to interact with CAP COM to meet their financial objectives.
We also want to efficiently use staff resources to meet member demand and eliminate the duplication of multiple areas creating the same report. That means providing easy, self-service access to data, dashboards, and reports to effectively manage their business unit.
Who is responsible for this?
MW: Overall, our BA/BI team is responsible for developing and maintaining our data aggregation plan, dashboards, data analytics, and predictive model creation for the organization, but were working closely with our senior leadership team to ensure our plan is in step with the overall corporate strategy, vision, and budget.
Depending on your definition of closed loan, you might get different answers. We want to reduce those discrepancies and establish a single source of truth.
Who are the end users of this data? What do they do with it?
MW: Identifying the data stakeholders is a key initiative when undertaking any reporting and data integration program. One of the first questions I ask when meeting with the business owners is, Who needs to see this data?
Some data elements are only for a specific department or area, other elements might be reported all the way up to the board. Its critical to understand who needs to see the data so it can be framed in a way that will make sense to that stakeholder.
For example, the board might need to see total loan production to understand how we are performing against budget and goals, whereas our lending and marketing teams need to drill down to specific loan types to determine if our promotion and marketing efforts are having the desired outcomes.
The BA/BI team will be responsible to not only provide the business unit with the data and analysis requested but also dig in and share things the business owner did not see or ask for initially.
Collaboration is critical to our success between the business owners and the BA/BI team.
What systems are involved in this data aggregation?
MW: Our initial integration is with our Episys core. Our long-term goal is to establish data feeds with all of our major systems. That includes Meridian Link, Lending QB, FICS, Prologue, Vantiv/Worldpay, Salesforce, and our phone and HR/payroll systems.
Youve just rebuilt your Episys platform in what was essentially a re-conversion. What role does that play in your data aggregation journey?
MW: Its critical to our overall integration strategy. Were completing the re-conversion and working to use the core as it was designed versus the highly customized solution that we had created over the years. This will allow us to create data definitions and establish common meanings, language, and terminology for our data elements.
A challenge for us has been different areas reporting on the same data point. For example, the number of closed loans. Depending on your definition of closed loan, you might get different answers. We want to reduce those discrepancies and establish a single source of truth.
But to get there, we needed to understand how the business uses the data. Going through the conversion forced us to look at those processes and kick-start the discussions to establish what those definitions should be and who was the owner of that data set.
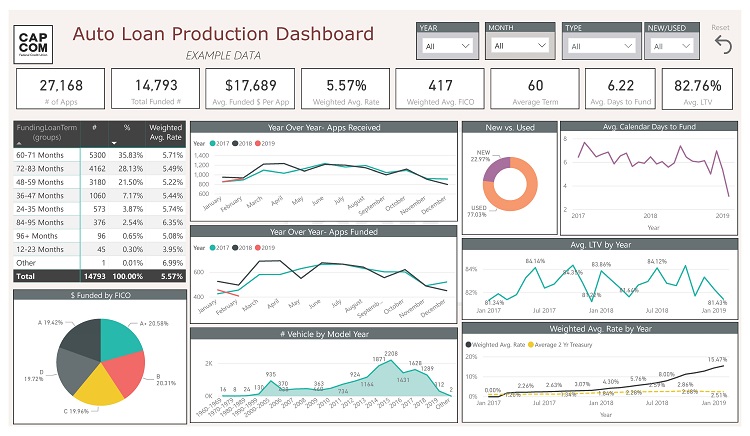
Auto lending is one of the products for which CAP COM is using Power BI to create dashboards around. (This example is a real dashboard but fake numbers.) To view the enlarged version, click here.
What role does your centralized data warehouse play in this work?
MW: It is going to be the cornerstone of our enterprise analytical reporting. Being able to have a system where we can not only aggregate large data sets but also eventually integrate data sets from multiple source systems will give us insights into our information that we previously never had access to.
OnApproach, from a long-term strategy prospective, allows vendors and other credit unions to share reports, dashboards, and predictive analytics models with us to reach our full potential sooner than we could by creating this all internally.
Where is CAP COM in its execution of the aggregation plan?
MW: Were still in the early stages. From a systems perspective, our core integration with OnApproach is scheduled to go live in March. From there, well start exploring what the true capabilities of the platform are.
Well need to begin planning the next set of systems to be integrated. Itll be critical to also begin delivering small wins for our business units along the way with reports, dashboards, and analysis of the data we have available. We cant wait until all system integrations are completed to begin producing.
From an overall perspective, weve begun the process of using our data by working to better understand our overall loan environment. Weve been working with our consumer and mortgage lenders and our financial analysts to better predict our overall lending performance.
The goal behind this initiative has been to allow our lending teams to focus on strategy and where we want to go versus researching what happened in the past. If we can predict performance, we can develop strategies that can impact performance versus trying to analyze what happened after the fact.
Using our data sets, weve been able to develop a model that has predicted our loan production within 5% of actuals and has allowed our lending leadership teams to turn their attention toward enhancing our member offerings.
Using our data sets, weve been able to develop a model that has predicted our loan production within 5% of actuals and has allowed our lending leadership teams to turn their attention toward enhancing our member offerings.
Why is this work important now?
7 Tips For Better BI
Mike Wiseman, business intelligence analyst at CAP COM Federal Credit Union, offers a few best practices that the BI team at CAP COM has learned in the early days of the credit unions three-year data aggregation journey.
- No two credit unions have the exact same strategy. Take the time to talk to and learn from them as well as other partners or vendors.
- Develop a strategy before hiring a team. Figure out what skill sets the credit union needs versus creating the team and figuring out what each team members will do.
- Obtain senior leadership buy-in. Implementing a data strategy is a culture change and impacts the entire organization. Buy-in begins at the top.
- Remain flexible and expect change. The plan will evolve as the team tries different processes and learns more. What you initially thought was going to work probably wont.
- Communicate with all the stakeholders to keep them up to speed.
- Learn the business. Spend time with the business teams to learn how they use the data on a day-to-day basis. Its no use creating a report or dashboard that isnt helpful to them.
- Challenge the team to ask why? Everyone thinks they need a report or wants the data in a dashboard with charts and graphs. But what are they going to do with the information? Can their needs be met in another way? Does the information already exist? Why is this the best solution?
MW: CAP COMs purpose is to Benefit Every Member, Every Time, Every Day. As the financial services world continues to evolve and members expect both digital and in-branch experiences that are in line with major technology players such as Facebook, Amazon, and Netflix, CAP COM needs to evolve its data strategy to remain relevant.
To provide a high-touch, member-centric experience tied to the specific needs and circumstances of the individual member, we need to not only collect all of the necessary data and information on the member but also have an area of the business thats specifically focused on analyzing this data.
To keep benefiting every member, every time, every day, we need to understand what those members want and develop programs to easily offer them those products, regardless of the channel they interact with us through.
How will CAP COM get the most return on this initiative?
MW: By improving the member experience by developing a market strategy that is personalized, timely, and delivered through the channel they prefer.
We expect to grow membership this way. And we need to. Population growth in our area will not support the growth level in our three-year strategic plan, so we need to find ways to better position our institution.
This interview has been edited and condensed.
Dig Deeper Into Data
Want to see how your numbers stack up against your peers? Build displays, filter data, track performance, and more with Callahans Peer-to-Peer.