Top-Level Takeaways
-
Indiana’s largest credit union is building out automated processes that began 25 years ago with a rudimentary database and reporting.
-
Institutional memory and sophisticated data analytics are joining enterprise-wide engagement to improve processes and enhance decision-making.

Sherri Stewart, Database Developer, Teachers Credit Union
Robots don’t stuff envelopes and lick the stamps at Teachers Credit Union (TCU) ($3.3B, South Bend, IN), but they have greatly sped up the process of determining who gets those letters and why.
Twenty years ago, Sherri Stewart began building the Hoosier state cooperative’s first data warehouse, producing time-consuming reports on request using Excel and her own growing expertise. Today, robotic process automation software is driving the credit union’s efforts to report on performance and improve its internal processes.
Stewart is still at TCU, but now the 26-year employee is a member of the business intelligence team and still learning and implementing new techniques. The newly reconfigured group utilizes sophisticated analytics software to extract and make meaning out of millions of pieces of data that flow every day into the credit union’s SQL-based data warehouse from various processing and transaction systems.
Our first problem when we began this transformation a couple years ago was to take all the information in Sherri’s head and to translate it for our member-focused workforce, says Michael Benassi, senior director of data insights and digital transformation at TCU. Institutional knowledge is a huge part of building a successful data platform.
So is input from everywhere.
Make Analytics For Everyone
Join us on Wednesday, October 3, 2019 for the next Tableau User Group Meetup. Presenters will discuss enablement, se union. All are welcome, regardless of your institution’s technology.
![]()
Knowing the most often asked questions along with likely follow-up questions allows you to build dashboards and data structures that facilitate quick delivery of insights and action items, Benassi says. It reduces the back and forth between the data analyst and the data user. Being able to pre-plan and tackle sticking points reduces effort and cost.
Benassi is heading up the data analytics revolution at TCU. He’s been with the credit union for more than 16 years and moved into business intelligence after several years in the finance department. His new title is part of a restructuring that has him leading a data analytics team and business transformation team that includes database professionals, developers, and specialists in robotic process automation, business intelligence and business processes.
The business intelligence team focuses on building the dashboards and the business transformation team helps stakeholders across the enterprise learn how to use these new tools to solve old problems.
The retail, finance, and executive management teams have been the most engaged so far, but Benassi expects that enthusiasm will spread.
People love getting this kind of information, but there were previously roadblocks and bottlenecks, the senior director says. The most rewarding part for us is being able to provide data in much more usable ways than they’ve ever imagined.
To do that, Benassi and his colleagues evaluated various business intelligence and data visualization tools, including PowerBI, Tableau, and others. In October 2016, the credit union deployed Qlik for its dashboards and later in 2018 integrated UiPath for RPA.
The results quickly began adding up.

TCU’s dashboard includes a tally of work hours saved by robotic process automation in the 11 months it’s been in use: 17,065. Click here to view larger.
TCU has also created a governance council of its staffers who are learning the data available and creating the institutional definitions of that data. One of the council’s responsibilities simply identifying the next most important topic might appear basic at first blush but can prove to be quite complicated due to data limitations and the diverse needs of departments.

Michael Benassi, Senior Director of Data Insights and Digital Transformation, Teachers Credit Union
For example, if a credit union wants to gauge membership growth, it must first determine who a member is. Turns out, there are many ways to define member management definitions and regulatory definitions to name but two. That’s how there can be, for example, 300,000 members according to the core system’s tally of open accounts of any kind but only 295,000 by a regulatory definition that requires someone to have $5 in a primary share account.
Sherri and the council knew of seven different ways of defining who’s a member, Benassi says. Now, we’re all working together on more than 40 different definitions of all kinds, not just members, to come to a common understanding of terms that we can use to drive our data reporting and analysis.
The credit union uses those definitions when generating reports, which are called apps in the Qlik system. Teachers already has deployed more than 110 apps that report on everything from branch cash needs to cross-selling activity at the member call center, and to track retail performance.
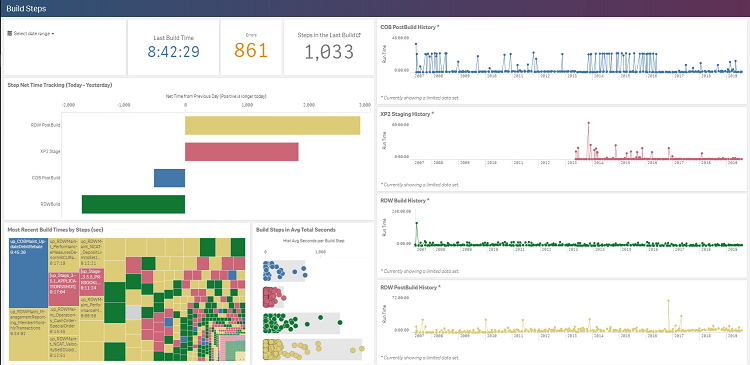
A dashboard from the nightly data store build process app shows the length and variation of the daily data-building processes. The header Most Recent Build Times shows it’s taking 45 minutes and 30 seconds every day to update member debit rebate records. Click here to view larger.
As Teachers shifts to more data-driven decision-making, Benassi wants to make sure he clearly demonstrates the value and impact of his teams’ efforts. To help other credit unions do the same, he offers a few lessons learned along the way:
- Have conversations with executive management to make sure they’re comfortable with what the data team is doing.
- Explore the various platforms to ensure the credit union chooses the best option for its needs.
- Work for conformity in standard definitions for every measure and process.
- Strive for quick wins, and see where they take the team.
- Make sure the credit union’s data is secure, and understand the access levels being granted to different people in different positions.
- Be open to input from all over.
Notably, some of the more curious questions Benassi has fielded have come from non-technical colleagues, who wonder, for example, if those robots can stuff and mail an envelope.
No, of course not, the TCU data insights and business transformation director says. But, we can use RPA to quickly determine who needs a letter about a certain topic and then provide a file to our third-party vendor that mails those letters.
That, he says, shows why it’s important to be open to learning along the way.
When we started building apps, that process alone began revealing questions we never would have realized to ask before, Benassi says. Our best advice for beginning automated analytics work is to get in there, start building, and see what pops up.
4 Ways To Apply Apps
Teachers Credit Union uses dozens of apps the term it uses for its data analytics dashboards to quickly deliver actionable insight across the enterprise. Here are four ways the credit union has used apps to improve performance.
- After rolling out a call center app, business partner referrals in the first month increased from 73 to 224. That’s a 29% increase in referrals that turned into additional products and services for members.
- A branch cash use app provides data down to the drawer level for each location. That has helped accurately predict cash use at times of high demand, such as tax return season, and has reduced the need for expensive emergency cash deliveries.
- The nightly build process application helps isolate issues and identifies if they are a trend or an anomaly. This helps reduce investigation time and put design time where it provides the most value to the credit union.
- Share Change Tracker has given Retail a day-to-day tracking system to determine the origin of share gains and losses. The daily update allows for quick analysis of a branch’s deposits, gives the retail units a more thorough understanding of the seasonality and history of each service type, and can be a helpful predictor for member attrition and account history.
