The U.S. unemployment rate fell to 3.5% in December 2019, the lowest year-end rate since 1968. Down from 3.9% year-over-year, the unemployment rate has improved for 10 consecutive years. This has driven up both competition for employees and total compensationacross the country. According to the Bureau of Labor Statistics, average employee compensation increased 2.7% in 2019. Wages grew 2.9% year-over-year while benefit packages expanded 2.2%. Compensation grew at a slightly faster pace than inflation,which was up 2.3% annually at year-end 2019. The federal minimum wage has not changed in the past decade and remains at $7.25 an hour despite stark increases in the cost of livelihood. Although wages are increasing nationwide, they are doing so atslower rates than the cost of living.
Key Points
- The number of full-time employees industrywide grew 4.3% annually to 304,200 at year-end. Meanwhile, the number of part-time workers fell 11.1% to 24,200.
- The average compensation expense per FTE* expanded 6.0% annually to $79,600. This is the greatest calendar year increase since 2002.
- The average YTD revenue generated per FTE hit $261,300 in 2019, up 7.2% annually.
- Net income per FTE increased 4.6% year-over-year to $45,100 in 2019. In 2018, this measure was up 20.1%.
- The average loan production per FTE was a calendar year record of $1.7 million in 2019. In the fourth quarter alone, production per FTE was $465,800, a quarterly record.
FULL-TIME AND PART-TIME EMPLOYEES
FOR U.S. CREDIT UNIONS | DATA AS OF 12.31.19
Callahan & Associates | CreditUnions.com
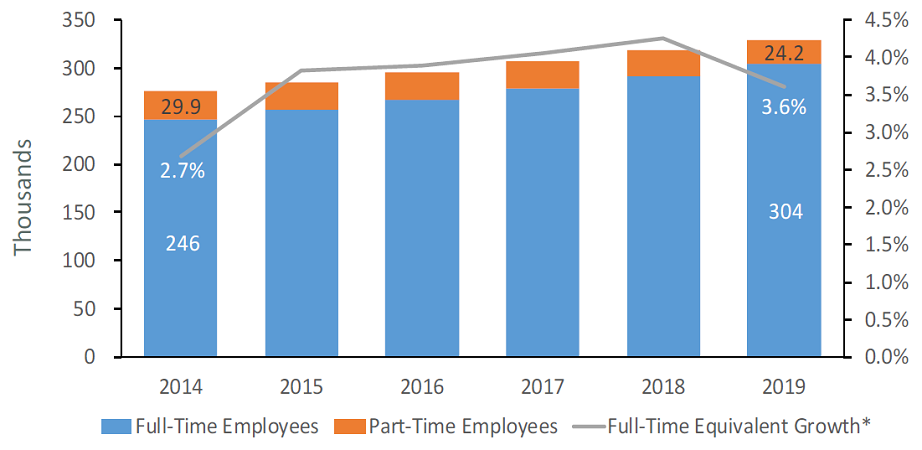
The percentage of credit union employees who are full-time has increased to 92.6% at year-end 2019 from 91.5% one year ago.
SALARY & BENEFIT EXPENSE PER FTE
FOR U.S. CREDIT UNIONS | DATA AS OF 12.31.19
Callahan & Associates | CreditUnions.com

Credit union compensation per FTE increased 6.0% annually. That’s more than double the 2.9% for the economy as a whole in 2019.
ANNUALIZED NET INCOME PER FTE
FOR U.S. CREDIT UNIONS | DATA AS OF 12.31.19
Callahan & Associates | CreditUnions.com
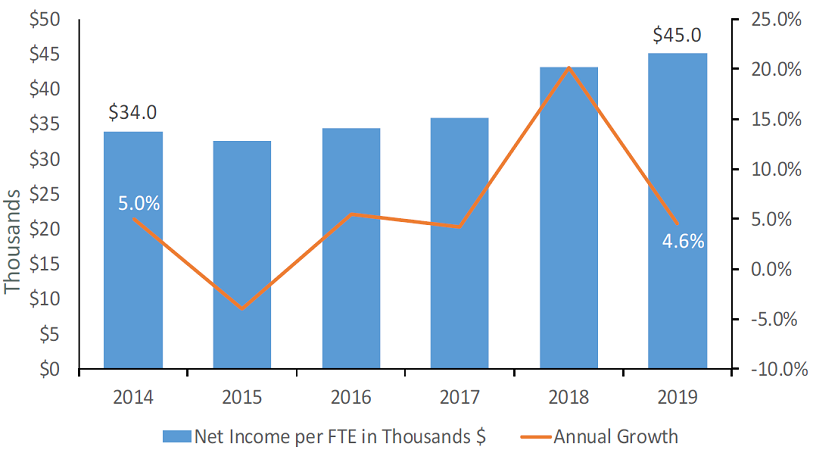
Net income growth per FTE slowed dramatically following increases in both compensation and cost of funds.
The Bottom Line
Across 2019, the success of the national labor market increased competition for talent and required credit unions to revise their staffing models; now hiring more full-time employees in lieu of part-time ones. In today’s stressful and uncertain climate,credit union’s willingness to invest in people will provide solace and stability for employees.
*FTE=Full-time Equivalent=100%FT + 50%PT
This article appeared originally in Credit Union Strategy & Performance.