Credit unions delivered exceptional value to members in 2017 across a host of metrics. Read on to see how macro economic and credit union specific trends will influence the industry in 2018 and beyond.
Macro Economic Trends
Index Performance, Market Volatility, And Rate Hikes
-
The United States has surpassed 103 months of expansion in an environment where the average economic cycle is 58.4 months.
-
The Fed is projecting three rate hikes in 2018.
-
The Small Business Optimism Index increased two points in January to 106.9.
According to the National Bureau of Economic Research, an economic expansion is a period when economic activity rises substantially, spreads across the economy, and typically lasts for several years.
The United States has surpassed 103 months of expansion in an environment where the average economic cycle is 58.4 months.
Many economic indicators point to a strengthening economy the unemployment rate in December was 4.1% and the stock market soared at the end of 2017 but economic growth in the United States slowed unexpectedly in the fourth quarter.
ContentMiddleAd
Read the full analysis or skip to the section you want to read by clicking on the links below.
MEMBERS, EMPLOYEES, REVENUE LOAN COMPOSITION FIRST MORTGAGE LENDING ASSET QUALITY SHARE BALANCES SHARE COMPOSITION BUSINESS MODEL/BOTTOM LINE A LOOK AHEAD
GDP grew at an annual rate of 2.5% from October through December coming in weaker than analysts’ expectations of 3.0%. For perspective, the two quarters prior exceeded 3.0% growth. The Core PCE (personal consumption expenditures) price index, which exposes trends in inflation, rose at an annualized 1.9% at yearend, just below the Fed’s target range of 2.0%.
The Employment Cost Index (ECI) rose 0.6% in the fourth quarter. As of Dec. 31, it was up 2.6% year-over-year, which is the highest in the current expansion phase. Increased volatility in the equities market followed the stock market surge at year-end. The VIX Index, the stock market’s expectation of volatility, eclipsed 50 in the first quarter of 2018. Since the Great Recession, the VIX Index exceeded 50 only one other time, in the third quarter of 2015.
Expectations for higher wages and inflation, rising federal deficits, and higher treasury yields with the resulting impact on equity valuations, along with a tighter monetary policy from the Fed, are all contributing to anxiety and volatility in the markets.
Congress agreed to a two-year federal budget that increases government deficit spending, which is unparalleled in an economic expansion phase. This deficit spending combined with the tax reform caused interest rate strategists to increase their long-end yield forecasts in 2018. When deficit spending increases, the treasury department typically funds the increase by issuing more debt, which puts upward pressure on yields across the curve.
The Fed is projecting three rate hikes in 2018 the first increase of 25 basis points occurred on March 21, 2018 and raised the Fed funds rate to 1.75% although several economists are projecting four. The Small Business Optimism Index jumped two points to 106.9 in January as a record number of small business owners suggest the current environment is a good time to expand, according to a National Federation of Independent Business survey.
Credit Union Trends
Members, Employees, Revenue
-
Annual membership growth continued at a near-record pace, 4.1%.
-
The average member relationship increased to $18,309.
Like the overall economy, an array of indicators in the credit union space conveyed a strengthening industry at year-end despite slowdowns on both sides of the balance sheet.
Credit union assets increased 6.6% annually. That’s down 80 basis points year-over-year. At 10.0%, loan growth was also strong albeit 50 basis points slower than one year ago. On the liabilities side of the balance sheet, share growth was 6.0%, which was down 1.6 percentage points annually.
Overall, volume climbed across the board and industry growth remained strong amid slowing rates.
Annual membership growth continued at a near record pace, 4.1%, and credit unions served nearly 113 million members across the nation at year-end. What’s more, the movement has deepened retail relationships. The average member relationship expanded 3.3% annually to $18,309. The average loan amount (excluding business loans) per member reached $7,982 , and the average share amount per member topped $10,327 at year-end.
To meet the customer service standards for which credit unions are known, the industry added 11,329 full-time equivalent employees to its roster in 2017. The movement employed 306,888 FTEs as of Dec. 31 a 3.9% year-over-year increase over 2016.
Total revenue across the industry has been on a positive trajectory since 2014 and increased 9.6% annually in the fourth quarter of 2017 to reach nearly $66.0 billion. Capital expanded 7.8% year-over-year to $158.0 billion. That’s up from 6.6% annual growth in 2016.
INDUSTRY OVERVIEW
DATA AS OF 12.31.17
Callahan & Associates | www.creditunions.com
| Data As Of 12.31.17 | 12-Month Growth 2017 | 12-Month Growth 2016 | |
|---|---|---|---|
| Assets | $1.4T | 6.6% | 7.4% |
| Loans | $967.9B | 10.0% | 10.5% |
| Shares | $1.2T | 6.0% | 7.6% |
| Investments | $355.1B | -1.8% | -0.1% |
| Capital | $158.0B | 7.8% | 6.6% |
| Members | 112.7M | 4.1% | 4.1% |
Investments aside, overall volume increases across the industry.
Source: Callahan & Associates.
Loan Composition
-
Loan originations reached a record $485.5 billion in 2017.
-
First mortgage, other real estate, and credit card loans grew faster in 2017 than in 2016.
Loan originations in 2017 reached an all-time high of $485.5 billion, even as the annual growth slowed from 12.3% in 2016 to 5.2% as of fourth quarter 2017.
First mortgage, other real estate, and credit card loan balances accelerated faster in 2017 than in 2016. New and used auto loan balances expanded at the fastest rate in the loan portfolio 13.2% and 10.2%, respectively although that double-digit growth did not reach the highs achieved in 2016.
12-MONTH GROWTH IN LOANS OUTSTANDING
FOR U.S. CREDIT UNIONS | DATA AS OF 12.31.17
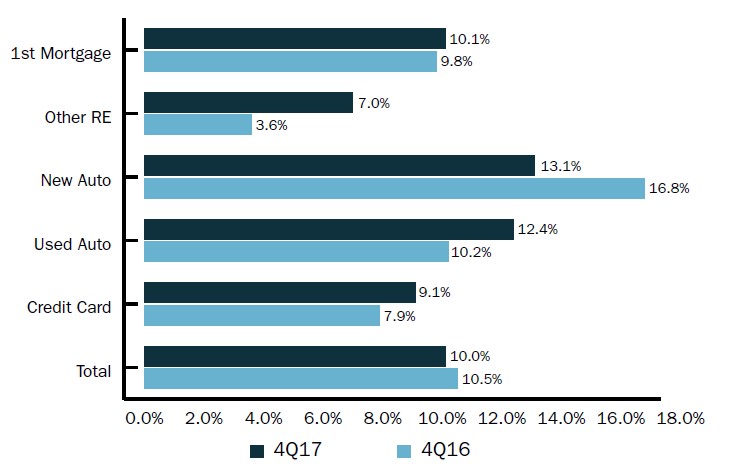
First mortgage and credit cards grew at a faster rate than last year, but overall loan growth fell by 50 basis points compared to fourth quarter 2016.
Source: Callahan & Associates.
First mortgages comprised the largest share, 40.8%, of the credit union loan portfolio. Whereas this is unchanged from last year, auto loans and student loans increased their share of the lending pie.
The share of total auto loans has expanded nearly 5.0 percentage points over the past five years and reached 34.7% as of Dec. 31. Indirect lending is a major contributor to this rapid increase and accounted for 58.3% of total auto loans at year-end 2017.
As the credit union auto loan portfolio increases, so, too, does the credit union market share of auto financing. The industry’s auto market share increased from 18.0% in 2016 to 19.2% at year-end 2017.
Castles, cars, and now cards. The percentage of members taking out a credit union credit card has jumped from 15.3% five years ago to 17.5% as of fourth quarter 2017. Credit card balances increased 9.1% year-over-year and surpassed $58.0 billion as of Dec. 31.
The industry’s loan-to-share ratio hit a near-record high of 82.5% at year-end. This ratio peaked at 83.7% in the third quarter of 2008 and dropped substantially during the Great Recession dipping all the way to 65.9% in the first quarter of 2013 before gradually rebounding.
Fueled by 14 consecutive quarters of double-digit loan growth that outpaces share growth, the industry’s loan-to-share ratio continued its ascent in the fourth quarter of 2017.
First Mortgage Lending
-
irst mortgage loans accounted for 40.8% of all lending at credit unions.
-
The share of balloon/hybrid and adjustable rate mortgages in the real estate portfolio increased, whereas the share of fixed rate loans decreased.
First mortgage loans continue to dominate the credit union loan portfolio. First mortgage balances increased 10.1% from Dec. 31, 2016, to Dec. 31, 2017. That’s 30 basis points faster than last year. Credit unions added $36.2 billion in first mortgages to their books in 2017 as first mortgages reached $395.2 billion at year-end. Other real estate balances were up 7.0% annually 3.4 percentage points faster than last year as consumers used the equity in their homes to fund other obligations.
Total first mortgage originations in the United States fell 11.7% in 2017, according to the Mortgage Bankers Association. Credit union first mortgage originations decreased only 1.9% annually. The industry originated $140.7 billion in 2017 after a record year for originations in 2016.
Notably, the balance between purchase and refinance first mortgage originations shifted year-over-year in the overall market. In 2016, 51% of all first mortgage originations were refinances, compared with 37% in 2017. Presented another way, 49% of all first mortgage originations in 2016 were purchase mortgages, compared with 63% in 2017.
At $228.0 billion in balances, fixed rate mortgages occupied the largest piece of the first mortgage portfolio at year-end. Balloon/hybrid loans followed at $108.4 billion, and adjustable rate mortgages came in third at $58.8 billion.
Although fixed rate loans made up the largest component of the first mortgage portfolio, the product’s share of the loan portfolio decreased 69 basis points year-over-year to 57.7%. The share of adjustable rate mortgages also decreased 43 basis points to 14.9% as of Dec. 31. Conversely, balloon/hybrid increased their share by 1.1 percentage point to 27.4%.
MORTGAGE ORIGINATIONS BY TYPE
FOR U.S. CREDIT UNIONS | DATA AS OF 12.31.17

Fixed rate mortgages were the loan of choice for credit union members in 2017; however, the share of that loan type relative to others fell year-over-year.
Source: Callahan & Associates.
Asset Quality
-
Credit union loan delinquency ended 2017 at 0.81%.
-
Credit card delinquency increased 15 basis points to 1.29%.
Credit union loan delinquency dropped 2 basis points year-over-year to 0.81%. This was 39 percentage points below the 1.20% of FDIC-insured banks as of fourth quarter an especially favorable comparison because credit unions report delinquency starting at 60 days, whereas banks report delinquency starting at 90 days.
At 1.57%, commercial loan delinquency had the highest delinquency in the loan portfolio thanks, in part, to taxi medallions. Commercial net-charge offs increased 65 basis points to 1.09% quarter-over-quarter. Because commercial lending was not broken out in the 5300 Call Report until third quarter 2017, annual data is not yet available. Excluding credit unions that have been impacted by the deteriorating credit quality of taxi medallion loans, commercial loan delinquency and charge-offs for the industry were 0.55% and 0.11%, respectively, at year-end.
The only loan product in which credit unions posted an annual increase in delinquency was credit cards. Delinquency for these loans was up 15 basis points year-over-year to 1.29%. Net charge-offs for credit cards also increased annually. They were up 34 basis points to 2.54% as of fourth quarter. Credit unions typically experience higher credit card delinquency in the fourth quarter as members make purchases for the holiday season. Since the fourth quarter of 2013, credit card asset quality has ticked up at year-end. By comparison, FDIC-insured institutions posted a credit card delinquency rate of 1.37% in the fourth quarter and charged-off 3.77% of all credit card loans. That’s up 10 basis points and 31 basis points, respectively.
After reaching a record high delinquency following the Great Recession 2.29% in the fourth quarter of 2010 first mortgage delinquency was down to 0.62% as of Dec. 31, 2017. That’s an increase of 5 basis points over third quarter 2017 and a decrease of 1 basis point over fourth quarter 2016. Auto loans also performed well; delinquency was down 2 basis points annually to 0.70% at year-end.
DELINQUENCY BY PRODUCT
FOR U.S. CREDIT UNIONS | DATA AS OF 12.31.17
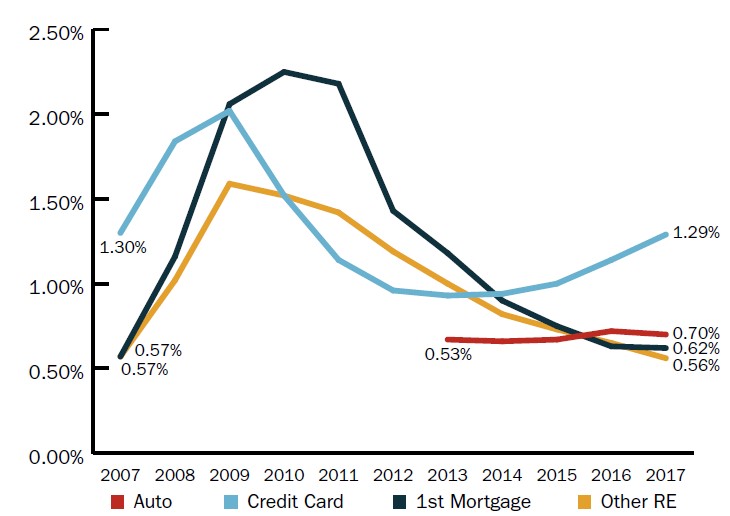
Credit card delinquency climb to 1.29%, whereas real estate assets performed better than other loan categories.
Source: Callahan & Associates.
Share Balances
-
Share balances increased $66.6 billion despite a slowdown in growth rate.
-
All share products except for IRA/Keough accounts recognized positive annual growth.
Share balances rose $66.6 billion in 2017 and hit a record high of $1.2 trillion as of Dec. 31. Growth in both share certificates and share drafts accelerated over last year and contributed $214.3 billion and $183.3 billion, respectively, in balances. Share certificates posted a fourth consecutive year of accelerating growth, good news for credit unions that generally use this share type to fund loans.
Balances increased across all share types except in IRA and Keogh accounts; however, total share growth decelerated 1.6 percentage points year-over-year. The largest slowdown in annual growth occurred among money market accounts where growth dropped from 7.5% in 2016 to 4.0% as of Dec. 31, 2017. Growth in regular shares and deposits decreased from 9.3% one year ago to 6.9% at year-end 2017. IRA/Keogh balance growth decreased by 0.9%.
The stock market surge at year-end contributed to the slightly slower year-over-year industry share growth. Historically, a rapid growth in the equities market has resulted in a decline in credit union share growth as members take out funds to invest. From 2016 to 2017, the Dow Jones accelerated 31.8% annually, whereas credit union share growth slowed to 6.0%.
Growth aside, balances within money market accounts totaled $262.4 billion as of fourth quarter. IRA/Keogh balances decreased 63 basis points annually and closed the year at $78.4 billion.
12-MONTH GROWTH IN SHARES OUTSTANDING
FOR U.S. CREDIT UNIONS | DATA AS OF 12.31.17
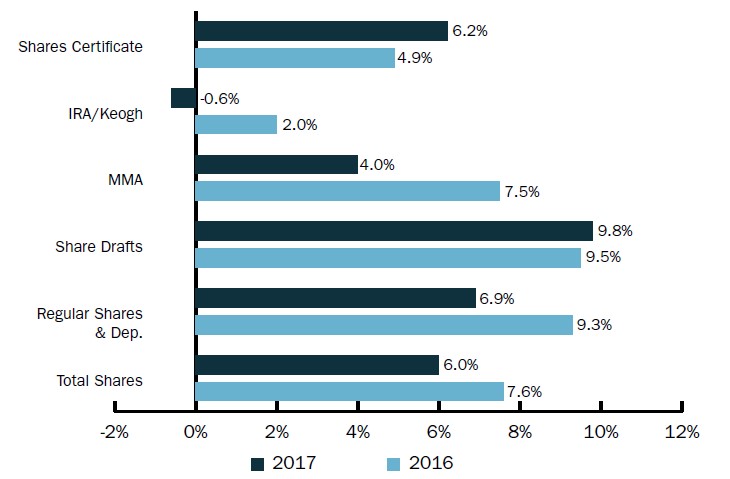
Growth in share certificates and share draft accounts accelerated in 2017 despite the overall deceleration in the industry’s share portfolio.
Source: Callahan & Associates.
Share Composition
-
Core deposits accounted for more than 75% of share balances.
-
The share of money market accounts and IRA/Keough accounts in the deposit portfolio decreased annually.
The credit union deposit portfolio changed slightly in 2017 from one year ago. Regular shares and deposits increased their piece of the portfolio by 2 percentage points and comprised nearly 37.2% of all shares at credit unions as of Dec. 31, 2017. Share drafts increased their piece of the portfolio by 54 basis points, whereas the share of the pie consumed by money market accounts decreased 43 basis points year-over-year. As balances decreased annually for IRA/Keough accounts, their piece of the share composition followed suit. Share certificates, on the other hand, captured slightly more of the pie. Over the past five years, the share for short-term deposits has increased, and the share for long-term deposits has decreased.
SHARE COMPOSITION
FOR U.S. CREDIT UNIONS | DATA AS OF 12.31.17
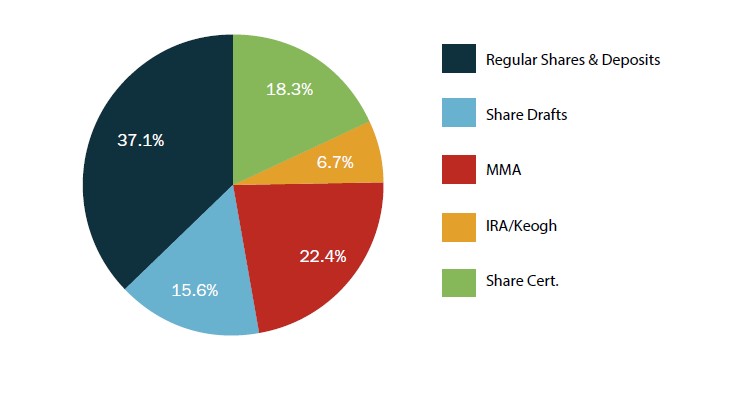
Core deposits accounted for more than 75% of the credit union share portfolio at year-end 2017.
Source: Callahan & Associates.
Share draft penetration increased 1.04 percentage points over fourth quarter 2016 to 57.2% as of Dec. 31, 2017. As of year-end, there were 64.4 million credit union share draft accounts an increase of 3.7 million accounts in 2017.
Share draft accounts are a general indicator that a member uses the credit union as their primary financial institution. As of fourth quarter 2017, credit unions with more than $1 billion in assets had a 61.5% average share draft penetration the highest of any asset group at year-end.
This could be because credit unions with larger asset sizes tend to offer more robust technology offerings and improved convenience. For example, among credit unions with more than $500 million in assets, 40.2% allow members to open a new share account online. That drops to 31.8% for credit unions with less than $500 million in assets. Furthermore, 40.9% of credit unions greater than $500 million in assets offer remote deposit capture, whereas 17.9% of credit unions less than $500 million in assets offer it.
SHARE DRAFT PENETRATION
FOR U.S. CREDIT UNIONS | DATA AS OF 12.31.17

Credit unions in larger asset ranges have a higher share draft penetration than credit unions in smaller asset ranges thanks primarily to delivery channel and technology offerings.
Source: Callahan & Associates.
Business Model/Bottom Line
-
Yield on investments improved 31 basis point to the highest rate since 2011.
-
The earnings gap closed to 10 basis points, the tightest since 2009.
-
97.7% of all credit unions met the NCUA’s 7% capitalization threshold requirement.
Total credit union revenue increased 9.6% year-over-year to $65.9 billion. Interest income, which made up nearly 73% of credit union revenue at year-end, also turned out the fastest growth of all income sources. It grew 11.4% year-over-year and surpassed $48.0 billion as of Dec. 31. Non-interest income accounted for a smaller proportion of total income but was the focal point for many credit unions. Other operating income accounted for more than half of non-interest income in the fourth quarter, whereas fee income accounted for 46.1%. Total non-interest income expanded 4.2% year-over-year to reach $18.3 billion.
YIELD ANALYSIS
FOR U.S. CREDIT UNIONS | DATA AS OF 12.31.17
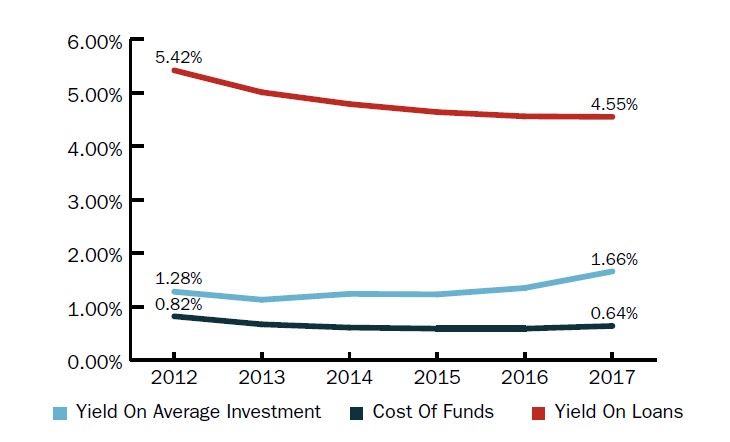
Yield on average investments increased 31 basis points in the past year to 1.66%. This is the highest year-end rate since 2011.
Source: Callahan & Associates.
Yield on investments improved 31 basis points year-over-year to 1.66%. This is the highest year-end rate since 2011. The low interest rate environment has led to a steady decrease in yield on loans since 2008. However, yield has remained relatively flat at 4.55% over the past year as the Fed raised rates 50 basis points in 2017. Credit unions can expect a small uptick in 2018 as three projected rate hikes take effect.
At 0.64%, the cost of funds closed out 2017 with an increase of 5 basis points. This is the first increase since 2008.
NET INTEREST MARGIN VS. OPERATING EXPENSE RATIO
FOR U.S. CREDIT UNIONS | DATA AS OF 12.31.17
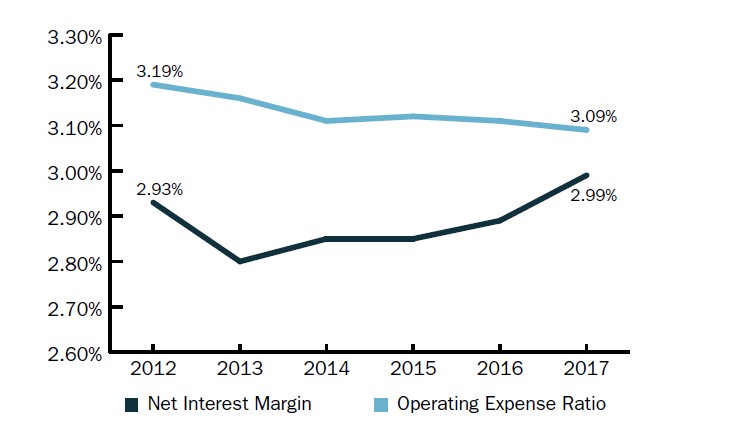
The earnings gap was the tightest since the second quarter of 2011, largely because the net interest margin increased 10 basis points year-over-year.
Source: Callahan & Associates.
An improvement in the margin across the industry has contributed to a steadily shrinking earnings gap (the operating expense ratio minus the net interest margin). The operating expense ratio, at 3.09%, was 10 basis points above the net interest margin, at 2.99%. This is the tightest spread since the second quarter of 2011. Since then, the net interest margin has been below operating expenses, although the gap continues to narrow thanks largely to a year-over-year increase of 10 basis points in the net interest margin.
The provision for loan and lease losses was up 8 basis points year-over-year to 0.48%. This has been on the rise for the past four years as credit unions reserve more in their allowance accounts to absorb possible credit losses and has reached its highest level since 2011. The industry’s ROA increased 1 basis point annually to 0.78% continuing it’s ascent.
The movement’s net worth ratio increased 6 basis points in 2017. At 11.0%, the industry, as a whole, continues to be well capitalized, according to NCUA standards. The industry’s net worth expanded 7.2% to $153.0 billion through the fourth quarter of 2017 while allowance for loan and lease losses grew 12.1% year-over-year. As of Dec. 31, 2017, 97.7% of all credit unions met the NCUA’s capitalization threshold requirement of 7%.
A Look Ahead
Despite slowing growth on the credit union balance sheet, there is still considerable momentum in the expanding economy. Economists’ reflection on 2017 note that robust consumer spending, business investments, and the stock market surge all contributed to economic growth and bode well for continued positive economic health in 2018.
It is ultimately the objective of the credit union charter to help members become financially healthy, thus enhancing their lives. What will your credit union do in 2018 to make a positive impact on your members?