Top-Level Takeaways
-
Credit Union of Vermont has ranked at or near the top of Callahan’s Return Of The Member metric for the greater part of the past decade.
-
A slim operating structure allows the institution to provide market-leading deposit and loan rates.
When asked how the Credit Union of Vermont ($47.5M, Rutland, VT) consistently provides exemplary member value, CEO Brian Fogg harkens back to his credit union’s original vision from 1958:
CU QUICK FACTS
Credit Union of Vermont
Data as of 06.30.18
HQ: Rutland, VT
ASSETS: $47.5M
MEMBERS: 3,080
BRANCHES:1
12-MO SHARE GROWTH: 4.5%
12-MO LOAN GROWTH: 8.0%
ROA: 0.93%
Eight guys from the post office didn’t get together to make a credit union for the purpose of gouging one another, says the CEO of Vermont’s 10th-largest credit. They wanted to provide good value for themselves and their members.
For more than 10 years, the Credit Union of Vermont has appeared among the chart toppers in Callahan’s Return Of The Member a proprietary metric that looks beyond CAMEL safety and soundness issues to arrive at a bottom-line number for member value.
ContentMiddleAd
ROM
FOR CREDIT UNIONS $20M-$50M | DATA AS OF 06.30.18

According to Callahans Return Of The Member index, Credit Union of Vermont has historically offered excellent return to its members.
Source: Callahan & Associates.
Callahan calculates ROM using a combination of interest rates and usage. When compared against the industry’s 1,049 credit unions with $20 million to $50 million in assets, Credit Union of Vermont ranked No. 2 in the second quarter
How does the credit union rank consistently top the charts? Fogg has the answers.
A Lean, Clean Operating Machine
Operationally, Fogg aims to run a clean operating cost structure. The $50 million credit union runs one branch without a drive-thru and has posted an operating expense ratio of less than 3% every quarter since the first quarter of 2009. Long-term, Fogg would like to drive that number below 2% so he can offer his members even more.
For each dollar we are not spending on operating expense, we can afford a lower loan yield, Fogg says. Better rates on loans, a better fee structure, and higher deposit rates.
OPERATING EXPENSE RATIO
FOR CREDIT UNIONS $20M-$50M; VERMONT CREDIT UNIONS | DATA AS OF 06.30.18

By keeping its operating expenses low, Fogg aims to reapply those costs savings in member-centric ways, like better loan rates or lower fees.
Source: Callahan & Associates.
YIELDS, INCOME, AND RATES
FOR CREDIT UNIONS $20M-$50M; VERMONT CREDIT UNIONS | DATA AS OF 06.30.18
Callahan & Associates | www.creditunions.com
| Credit Union Of Vermont | Credit Unions $20M-$50M | Vermont Credit Unions | |
|---|---|---|---|
| Yield On Loans | 4.45% | 5.32% | 4.53% |
| Annualized Fee Income | $236,266 | $221,446 | $1,301,132 |
| Average Share Rate | 0.25% | 0.20% | 0.31% |
| Cost Of Funds | 0.91% | 0.38% | 0.64% |
| Annualized Non-Interest Income | $273,188 | $911,387 | $3,342,088 |
Key performance indicators at the Credit Union of Vermont look different than its asset- and state-based peers.
Source: Callahan & Associates.
Credit Union of Vermont derives three-quarters of its income from loans for which its yield is lower than state and asset-based peers and approximately 12.5% from fees which is higher than credit unions in the state but lower than credit unions of similar size. It’s one thing, Fogg says, for fee income to act as an important income stream; it’s another to nickel and dime.
We’re not dependent on it, and we’re not looking to maximize it, he says. Our success is not dependent on our members’ failure.
Fogg notes the credit union hasn’t raised its non-sufficient funds fee for nearly 20 years. And whereas it does charge fees to recover costs and curb abuses, its fee structure is designed to be as generous as possible.
One of the benefits of running an institution with low operating expenses is the ability to provide more competitive rates on loan and deposit products which often results in greater member usage.
The credit union has competitively priced its regular share products for its Vermont market, but it has aggressively priced its suite of certificate products. For example, the credit union’s special three-year term certificate pays 3.50% on balances up to $3,500. On its non-promotional certificates, the credit union’s four-year certificate pays 2.75% on balances up to $20,000. As of the second quarter, nearly 17% of Credit Union of Vermont’s members had a certificate with the credit union. By comparison, the average for all Vermont credit unions was 8.05%.
But lower operating expenses is not the only way Credit Union of Vermont is able to pay higher rates. It also carries a higher percentage of its earning assets as loans. As of the second quarter of 2018, Credit Union of Vermont’s loan-to-assets ratio was close to 70%. That number was closer to 50% for credit unions with $20 million to $50 million in assets.
Because the credit union carries more loans a higher earning asset than an investment it can afford to pay a better rate and earn a lower yield.
We have a lower loan yield, but our yield on assets is higher because we have a higher percentage of our overall assets in loans, Fogg says.
At midyear, the credit union’s 4.02% yield on earning assets bested both asset- and state-based peer performance.
The credit union isn’t exactly cavalier about who it lends to, either. In the second quarter, the credit union’s delinquency was 0.00%; this despite the fact the cooperative’s loan request approval rate is near 95%.
The Proof Is In The Pudding
When it comes to member value, the proof is often in the pudding. If members find value, they use the credit union’s products and services. And in these usage metrics, too, Credit Union of Vermont posts impressive performance. The credit union’s average member relationship in the second quarter, $24,000, bested the state average by approximately $6,000 and nearly doubled the asset-based average. The credit union’s usage by product is impressive, too.
Click the tabs below to view graphs.
CREDIT CARD PENETRATION
CREDIT CARD PENETRATION
FOR CREDIT UNIONS $20M-$50M; VERMONT CREDIT UNIONS | DATA AS OF 06.30.18
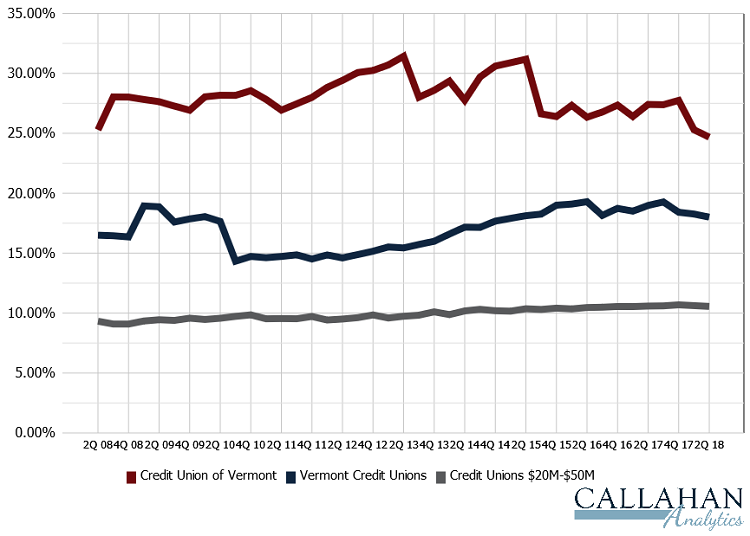
Historically, credit card penetration at Credit Union of Vermont has hovered at 25% or more. That’s well above state- and asset-based peer averages.
Source: Callahan & Associates.
AUTO LOAN PENETRATION
AUTO LOAN PENETRATION
FOR CREDIT UNIONS $20M-$50M; VERMONT CREDIT UNIONS | DATA AS OF 06.30.18
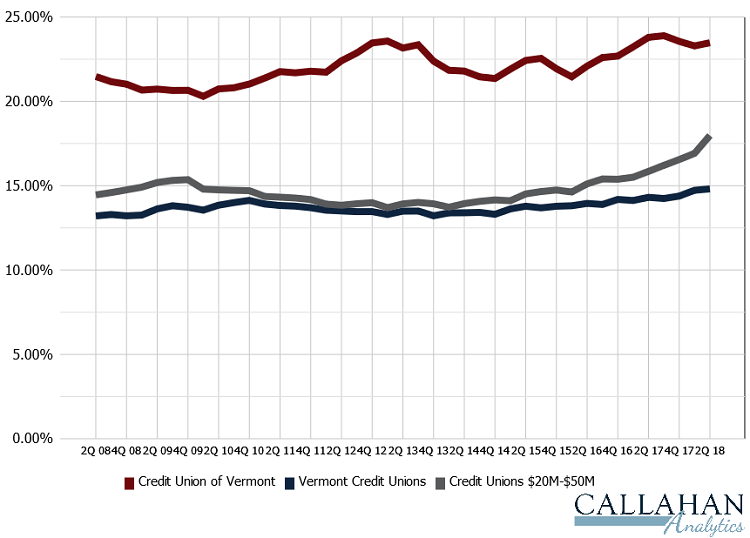
Auto loan penetration at the Vermont cooperative neared 24% at midyear. That’s six percentage points higher than asset-based peer average.
Source: Callahan & Associates.
SHARE DRAFT PENETRATION
SHARE DRAFT PENETRATION
FOR CREDIT UNIONS $20M-$50M; VERMONT CREDIT UNIONS | DATA AS OF 06.30.18
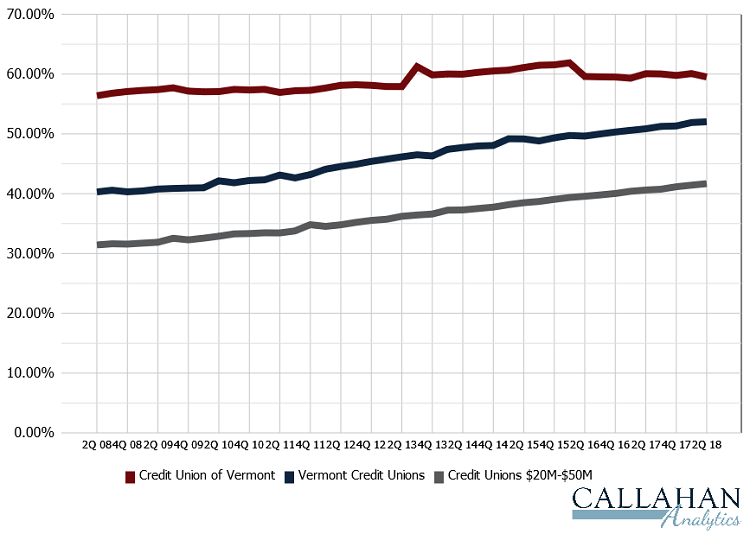
Share draft penetration for Vermont credit union is trending up, but Credit Union of Vermont outpaced the state average by nearly eight percentage points in the second quarter.
Source: Callahan & Associates.
We want our members to bring their business here, Fogg says. So, we have to make sure we are following through with value.
Focusing on rates brings value, but it doesn’t necessarily affect all members in the same way. To compensate for that, Credit Union of Vermont considers its fees.
I can pay 2% on a regular share account, but if a member has a balance of $100, what does that matter? Fogg says. For that person, the greatest benefit we can offer is to not charge them every possible fee we can come up with.
Fogg also says the credit union often foregoes rate increases on its variable-rate loans. For example, in January and July of 2018, the credit union could have adjusted rates on its $6.5 million home equity line of credit portfolio but declined to do so. By making that decision, Fogg estimates his shop gave up approximately $25,000 in income.
We think it’s the right thing to do, the CEO says. We take our mission statement seriously.
Offer consistent value for long enough, and members notice. It also helps differentiate his shop from other financial institutions in his market.
We say we’re constantly rated at the top for member value that gets people’s attention, Fogg says. Anybody can be a leader on any one particular day. It’s over a period that is the true measure.