Understanding how a credit union’s balance sheet is positioned for various interest rate risk scenarios is more important than ever for two reasons:
- There is uncertainty surrounding when or whether interest rates will rise in 2015.
- Interest rate risk examinations are focusing on the balance sheet and liquidity positioning of not only the credit union system but also individual credit unions.
There are three dimensions to interest rate risk: (1) balance sheet liquidity, (2) investment price risk, and (3) repricing opportunity.
Together, these concepts provide context to where asset-liability management (ALM) decisions place the credit union in relation to peers.
The following ALM trends for the credit union industry provide different ways to evaluate a credit union’s balance sheet positioning relative to its peers. Armed with this information, leaders can develop timely ALM strategies.
1. Balance Sheet Liquidity
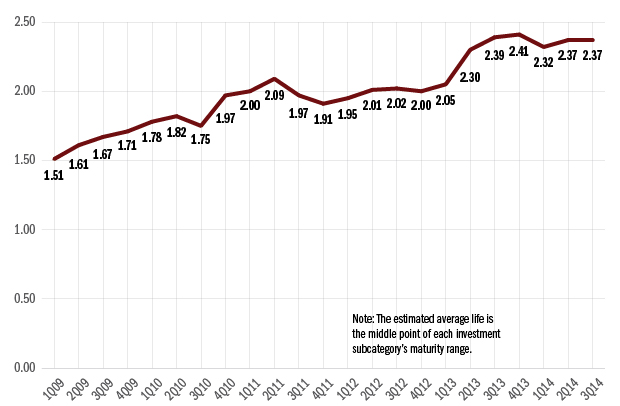
The weighted average life of an investment portfolio estimates the years for the total investment cash flows to be fully reinvested or repriced. Since September 2009, the credit union industry’s investment weighted average life has slowly extended to 2.37 years as of September 2014. Despite the lengthening weighted average life of investments, liquidity remains stable.
WEIGHTED AVERAGE LIFE OF INVESTMENT PORTFOLIO
For all U.S. credit unions Data as of Sept. 30
Callahan & Associates | www.creditunions.com
Source: Callahan & Associates Peer-to-Peer Analytics
2. Investment Price Risk
Price risk represents the fluctuations in the value of a security or a portfolio when market interest rates change; i.e., if interest rates increase, the value of a security decreases.
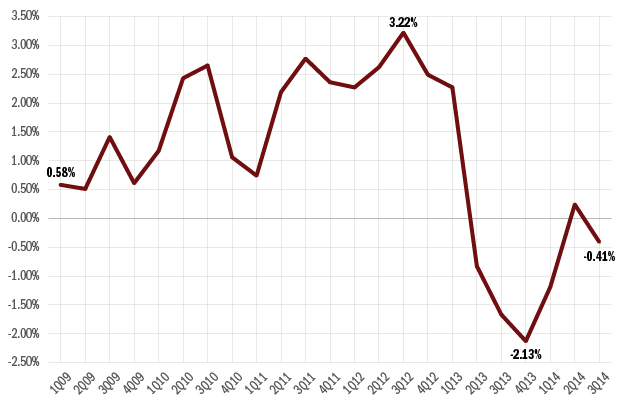
The estimated total current price risk for all investments both held-to-maturity and available-for-sale securities is limited for the industry. As of September 2014, the loss on the value of these investment securities is only 0.4% of total net worth at credit unions.
PRICE RISK AS A PERCENTAGE OF NET WORTH
For all U.S. credit unions Data as of Sept. 30
Callahan & Associates | www.creditunions.com
Source: Callahan & Associates Peer-to-Peer Analytics
3. Repricing Opportunity
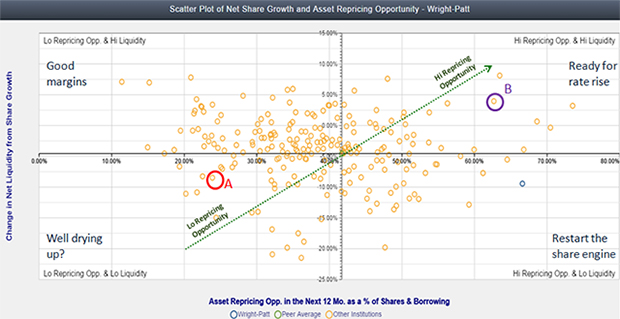
The scatter plot shows a credit union’s relative position in terms of both the change in net liquidity flow from shares ($) into investments and asset repricing opportunity in the next 12 months as a percentage of shares and borrowings.
NET SHARE GROWTH AND ASSET REPRICING OPPORTUNITY
For credit unions $1B+ in assets Data as of Sept. 30
Callahan & Associates | www.creditunions.com
Click On Graph For Larger View
Source: Callahan & Associates Peer-to-Peer Analytics
Vertical Axis: Change In Net Liquidity Flow From Shares ($)
This ratio divides the difference between the dollar share growth and dollar loan growth by the share balance as of a prior period. It shows the cycles of cash flows from shares into loans. When loan growth outpaces share growth, investments not new shares fund new loans.
Horizontal Axis: Asset Repricing Opportunity In The Next 12 Months As A Percentage Of Shares And Borrowings
This ratio provides a measure of estimated cash flows (consisting of estimated loan cash flows for the next 12 months, cash, and investments of less than one year) available that can reprice in the next 12 months if there is unexpected volatility in the funding base (i.e., share outflows or borrowing repayment). The higher the ratio, the greater the asset repricing opportunities the credit union has if interest rates change. As of September 2014, investments and loan cash flows that can reprice in the next 12 months is 42% of the funding base that is more than sufficient.
For example, A credit union has a lower-than-peer average (negative) value in the change in net liquidity from share growth (vertical axis) and a lower-than-peer average value in asset repricing opportunity (cash flows coming back in). The scatter plot shows that this credit union’s liquidity well might be drying up, an alarming position.
Meanwhile, B credit union has a relatively high net liquidity flow from shares and also a high repricing opportunities compared to its asset peers. As this credit union is posting positive share growth and expecting more cash flows coming in that it can reprice, it must be hoping for a rate rise.
Learn more about interest rate risk analysis and how to enhance your credit union’s ALM strategies by accessing Callahan’s ALM-Interest Rate Risk packet located in Peer-to-Peer under the Hot Topics section, or watch this preview clip from a Callahan interest rate risk webinar.