Year-end 2017 data is in the books. Now, what to do with it?
When creating year-end reports, credit unions should consider how they compare against the industry in loan growth, share composition, member growth, earnings, and asset quality. These five areas provide a different look at key components of credit union operations. Loans and savings reflect how effectively credit unions return value to members. Member growth is a good indication of how the industry compares to other banking institutions. Earnings reports show how efficiently the nation’s credit unions are operating, and asset quality trends help credit unions plan for future losses.
Lending
Interest on loans is the largest component of credit union income, and strong loan growth means more income. Comparing a credit union’s loan portfolio against the industry is a great way to start looking for new lending opportunities.
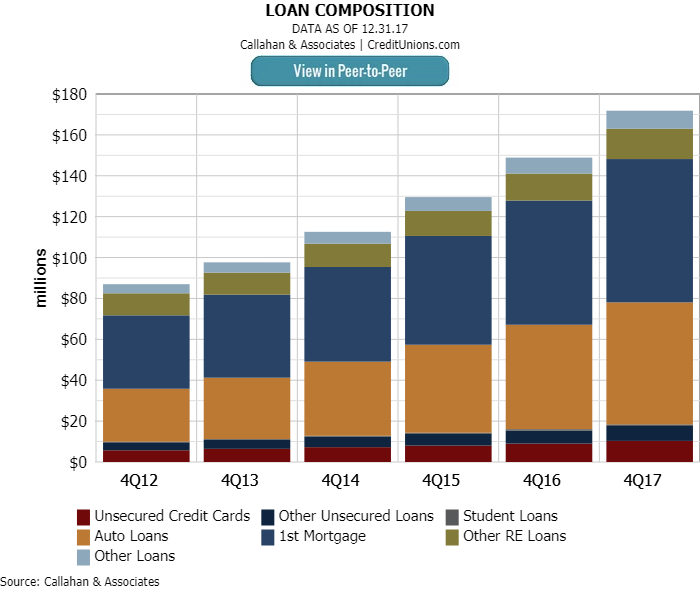
The industry posted its fourth consecutive year of double-digit loan growth. The graph above shows lending expanded 10.0% year-over-year. More importantly, it shows from where that growth came. Real estate loans accounted for almost half, 49.5%, of the loan portfolio. However, at 11.3%, the largest growth was in auto loans. Auto lending in 2017 was slower compared to 2016, but unsecured credit cards, other unsecured loans, student loans, first mortgages, and other real estate loans all grew faster in 2017 than 2016.
ContentMiddleAd
Deposits
Active share accounts indicate members use their credit union and trust their cooperative. In fact, share draft penetration is one way to gauge whether members use the credit union as their primary financial institution.

Credit unions posted year-over-year growth in all share categories aside from IRA/KEOGH accounts, although total share growth slowed in the fourth quarter to 6.0% from 7.6% one year ago. Share draft growth was the highest, 9.8%, and the category comprised 15.6% of the share portfolio as of year-end. And with 6.2% and 9.8% respective growth, share certificates and share drafts exceeded last year’s growth.
Members
Membership growth means a larger portion of the market is discovering the benefit of the credit union model. It can be helpful for credit unions that want to attract new members to see which regions are uncovering new membership opportunities.

At year-end 2017, the credit union movement counted 112,657,493 members nationwide. More than 1 million net new members have joined the industry’s rolls in the fourth quarter every year since 2010. For the year, year-over-year net membership increased 4.3% or 4.7 million in 2017. The NCUA’s Western region showed the strongest uptick, with 6.5% growth year-over-year. These new members primarily joined credit unions with more than $1 billion in assets.
Earnings
ROA is an especially important metric to follow in the fourth quarter, as this is when credit unions finalize all the year’s income and expenses.
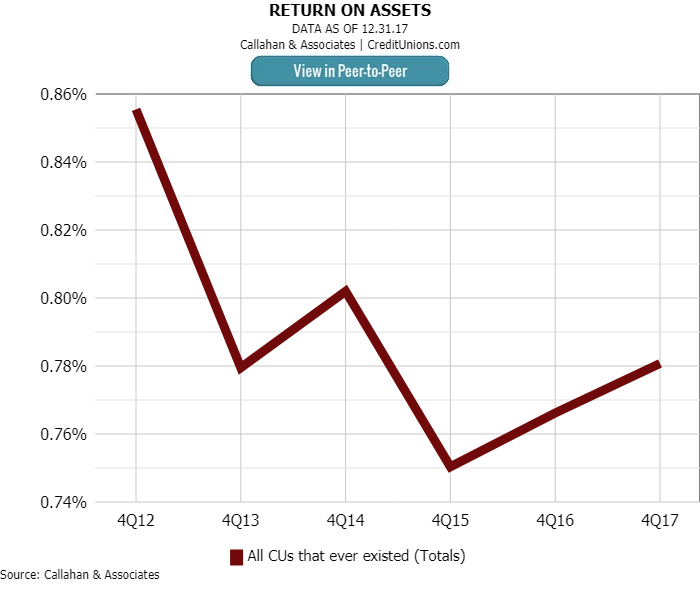
The industry’s ROA was 0.79% in the fourth quarter of 2017. That’s an increase of 2 basis points over the past two years; however, ROA is down 8 basis points from five years ago. The industry’s ROA might be settling into a new normal, but only time will tell.
Asset Quality
Credit unions need to closely monitor asset quality trends to prepare for future delinquencies and net charge-offs. Delinquencies and charge-offs have been trending upward and continued to do so in 2017. Armed with this information, credit unions can plan accordingly and decide whether it’s time to increase their provision expenses.

The total net charge-off ratio has increased 5 basis points since year-end 2016. Credit card net charge-offs increased 35 basis points over the past year to 2.5% as of fourth quarter 2017. Credit card net charge-offs make up 20.3% of all net charge-offs. Auto loan net charge-offs also increased in 2017, by 5 basis points. Conversely, first mortgage and other real estate net charge-offs have trended downward and both rested at 0.02% as of year-end 2017.
Taking an industry-wide look at these five areas is a great way to gain a big picture, holistic view of a credit union’s performance. But year-end reports also should include a more focused comparison of components like region, asset size, membership makeup, and more. What a credit union ultimately considers will rest on its business model and goals. Callahan & Associates helps credit unions determine where they want to dig deeper to serve members better. Learn more today.