The member-focused, not-for-profit model is attracting people to credit unions and encouraging them to take advantage of multiple service offerings. In the third quarter of 2018, credit unions are reporting upward penetration rate trends in credit cards, auto, and share draft penetration. Credit card penetration is on track to increase 4 basis points to 17.4%, auto 75 points to 21.1%, and share drafts 82 basis points to 57.8%.
This week, Callahan recapped the industry’s performance trends over the past three months, highlighted credit union success stories, and identified areas of opportunity during its quarterly Trendwatch.
ContentMiddleAd
Here are three takeaways for the third quarter of 2018:
No. 1. Membership Growth Reaches Record Level
Credit union membership has expanded 4.5% as 5 million members joined the cooperative movement in the past 12 months. This is a 45-basis-point acceleration from the growth credit unions reported this time last year. Today, credit unions nationwide serve more than 116 million members.
Credit unions also deepened their relationships with members. The average member relationship the sum of average share and loan balances per member excluding business loans is on track to increase $489 year-over-year to $18,684. With consumers feeling confident in the market, average loan balances are increasing at a faster rate 4.9% than the 0.5% for average share balances. However, at $10,383, the average share balance remains well above the $8,301 average loan balance per member.
MEMBERSHIP AND GROWTH
FOR U.S. CREDIT UNIONS | DATA AS OF 09.30.2018
© Callahan & Associates | www.CreditUnions.com
| Year | Membership Growth | Total Members |
|---|---|---|
| 3Q 2017 | 4.0% | 111,857,134 |
| 3Q 2018 | 4.5% | 116,865,579 |
Five million members joined a credit union in the past year, and the movement now serves nearly 117 million people.
No. 2. The Gap Between Operating Expense And Net Interest Margin Shrinks To Zero
The net interest margin increased 14 basis points in the past year to 3.12%. Over the same period, the operating expense ratio increased 5 basis points to 3.12%. This is the first time since June 30, 2011, that the net interest margin has been at or greater than the operating expense ratio. In addition to efficiently managing expenses, the net interest margin is improving as interest rates increase in lock step with the Fed rate hikes.
Furthermore, year-over-year income growth hit 13.1% as of Sept. 30, 2018. That equates to $55.1 billion in total revenue. Operating expenses increased at a slower rate of 8.1% and are on track to total $33.4 billion. This dynamic helped fuel net income growth of 25.8% in the past year, driving the aggregate bottom line of the industry higher to $10.0 billion. This is tangible value that credit unions can return to members or use to support growth initiatives.
NET INTEREST MARGIN VS. OPERATING EXPENSE RATIO
FOR U.S. CREDIT UNIONS | DATA AS OF 09.30.2018
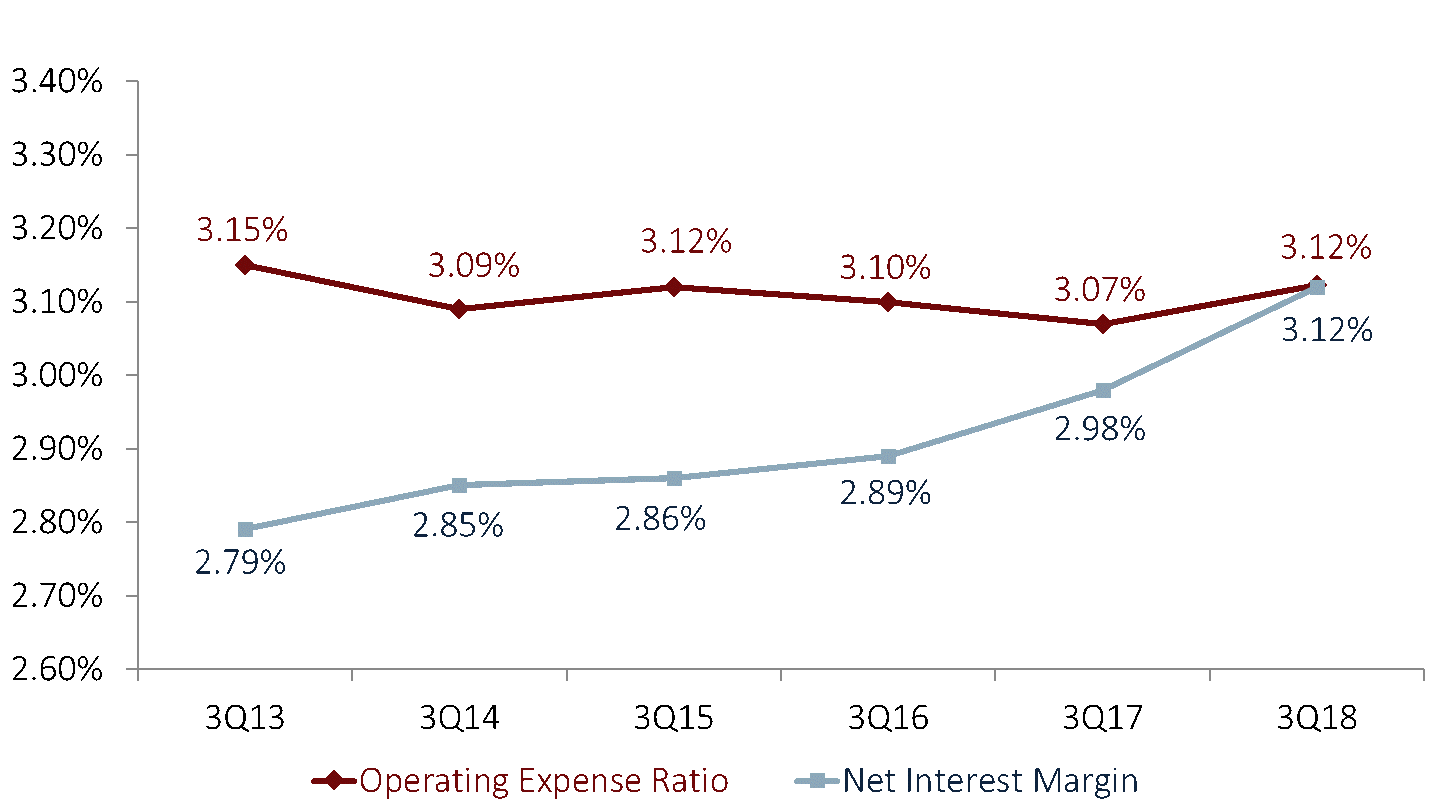
The net interest margin increased 14 basis points, whereas the operating expense ratio increased 5 basis points. Both are now 3.12%. This is the first time since June 30, 2011, that the net interest margin has been at or greater than the operating expense ratio.
Source: Callahan & Associates.
No. 3. Market Share Expands In All Major Loan Products
Credit unions have increased market share in all major loan products in the past 12 months. Credit unions now fund more than one-fifth of every auto loan originated in the United States. Up 1.4 percentage points year-over-year, auto market share in September hit 20.6%. This is an increase of 5.9 percentage points in the past five years. Credit union auto loan balances, which have risen 10.9% over the year and 86.6% over the past five years, are on track to reach $365.4 billion as of Sept. 30, 2018.
Credit unions reported the second consecutive year of market share expansion in first mortgages. Up 30 basis points in the past year and 1.4 percentage points in the past five, first mortgage market share is steadily climbing and hit a record high of 8.4% for the third quarter. Balances of first mortgages reached $105.5 billion as of Sept. 30. That’s up 1.1% from the year prior. Despite historically struggling in purchase markets, credit unions are now tapping into that market while remaining competitive in growing their share in a rising rate environment.
Credit unions also made gains in market share in revolving credit most commonly issued in the form of credit cards. That’s up 30 basis points year-over-year to 6.0%. For comparison, it was 5.0% in the third quarter of 2013. Revolving consumer loan balances increased 7.8% annually and totaled nearly $60.0 billion as of the third quarter of 2018.
MARKET SHARE BY LOAN TYPE
FOR U.S. CREDIT UNIONS | DATA AS OF 09.30.2018
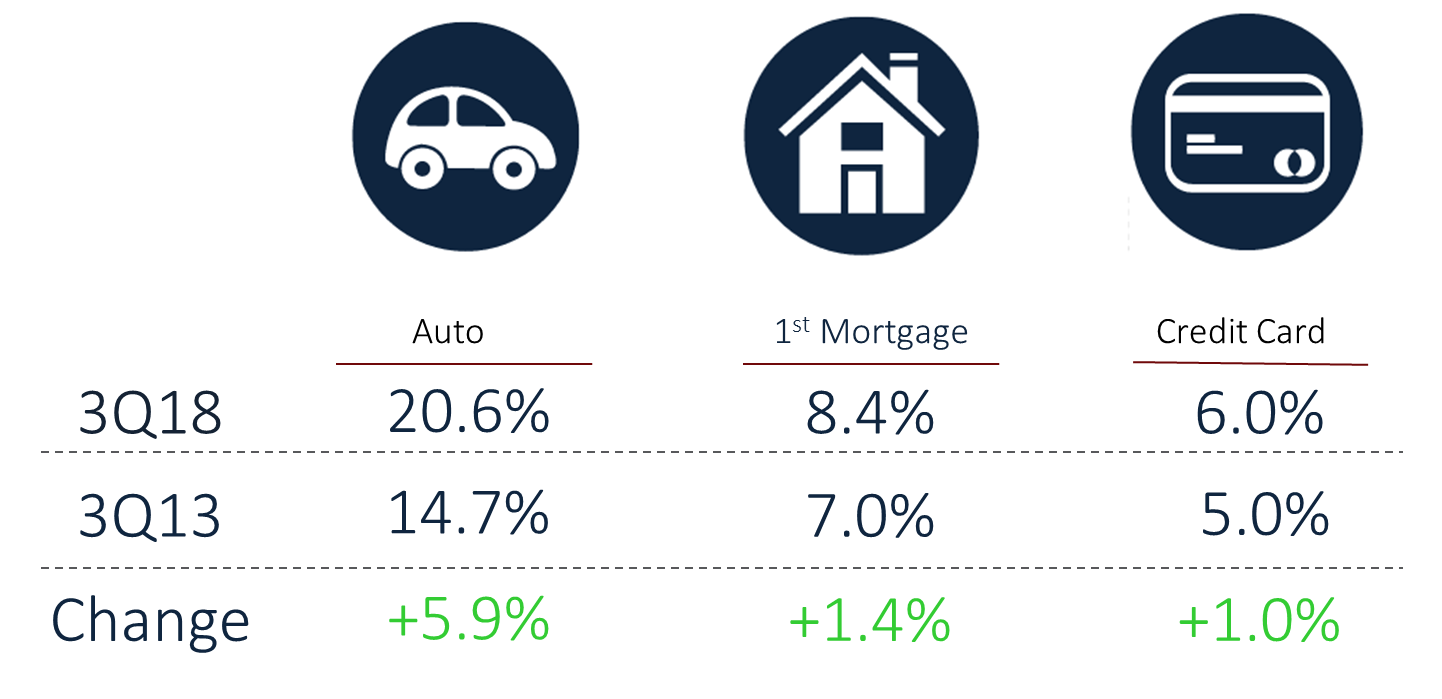
Credit union market share has improved across all major loan products over the past five years.
Source: Callahan & Associates.