Membership at U.S. credit unions increased 4.4% or 4.8 million members in the past 12 months to hit 115.5 million members as of June 30, 2018. As membership climbs higher, so, too, has the variety and number of accounts members hold with their credit unions.
1. Share Drafts
The number of share draft accounts has jumped from 52.9 million accounts as of June 30, 2014, to 66.4 million accounts as of midyear 2018. That’s an increase of 25.4% in the past five years. Share draft penetration likewise has increased. It rose from 53.4% in the second quarter of 2014 to 57.5% in the second quarter of 2018.
ContentMiddleAd
Over the past year alone, the number of share draft accounts has increased 5.8% and share draft penetration has increased 76 basis points.
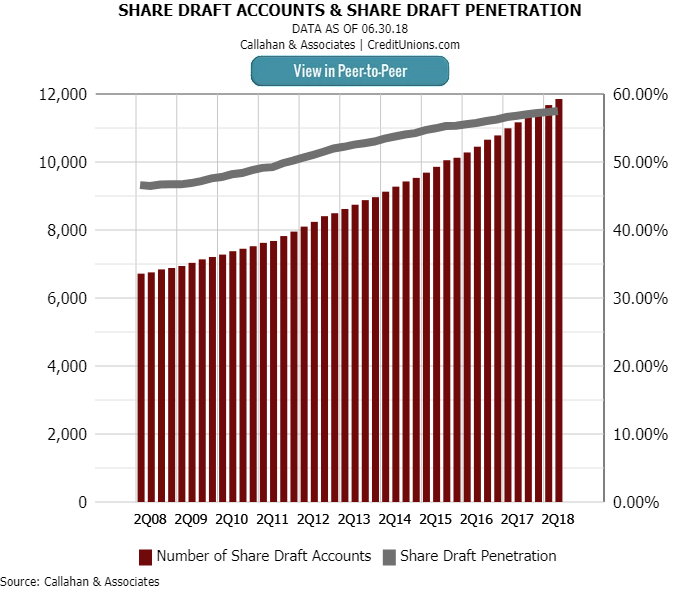
Share draft penetration increased 76 basis points year-over-year. It hit an all-time high of 57.5% in the second quarter of 2018.
On the asset side of the balance sheet, the number of auto loans has increased 8.5% year-over-year. The industry held 22.2 million auto loans in the second quarter of 2017 and 24.1 million as of June 30, 2018. Auto loan penetration has increased, too, from 20.0% as of June 30, 2017, to 20.8% as of midyear 2018.
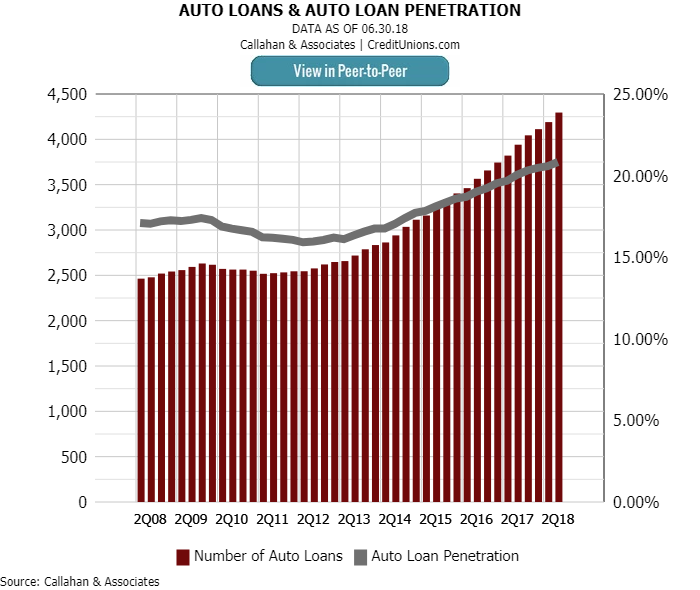
Credit unions held 1.9 million more auto loans in the second quarter of 2018 than they did in the second quarter of 2017; 63.3% of these loans were in used auto.
3. Real Estate Loans
As of June 30, 2018, credit unions had 5.1 million real estate loans in their portfolio. That’s 784,709 more than at midyear five years ago. Real estate penetration has fluctuated over the past five years but was 4.4% as of June 30, 2018. That’s 6 basis points higher than as of midyear 2014.
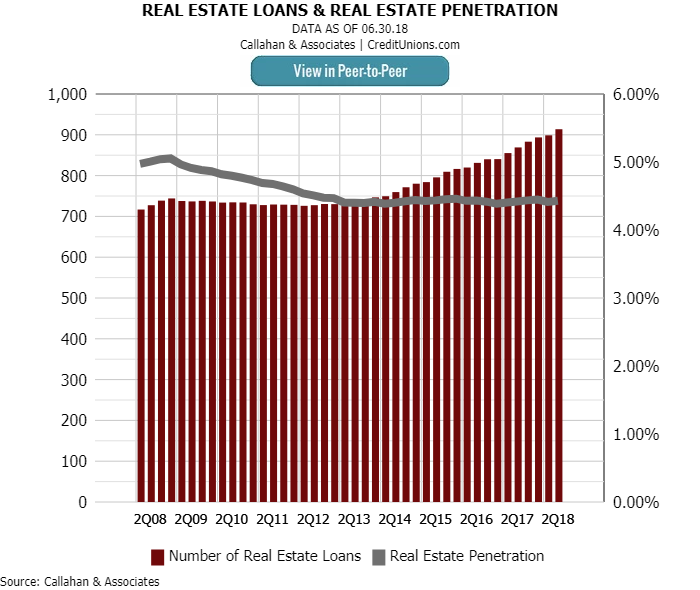
Real estate loans increased 4.7% year-over-year increasing from 4.9 million as of June 30, 2017, to 5.1 million as of June 30, 2018.
4. Credit Cards
The number of credit card loans at U.S. credit unions increased from 19.2 million as of second quarter 2017 to 20.0 million as of second quarter 2018. That’s a year-over increase of 4.3%. However, because credit card growth and membership growth differed by only 9 basis points, credit card penetration held steady at 17.3%.
A longer view, however, reveals the second quarter 2018 credit card penetration rate was 1.2 percentage points higher than five years ago.
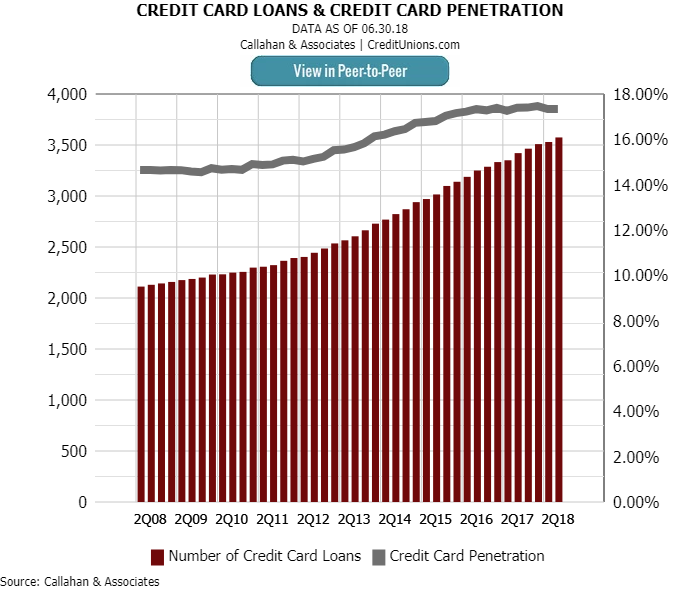
Credit card penetration growth slowed in the second quarter of 2018; however, the midyear rate was still up 1.2 percentage points over five years ago.