Callahan’s quarterly Trendwatch webinar dives into performance trends weeks before the NCUA officially releases 5300 data. Attendees walk away with an understanding of the industry’s role in the larger sphere of financial services as well as how to strengthen their own position in the credit union market.
It’s a great event to catch live, but the insights it provides don’t expire when the call ends. Prepare for final year-end data and identify benchmarks for 2018 by checking out notable year-end takeaways in five areas.
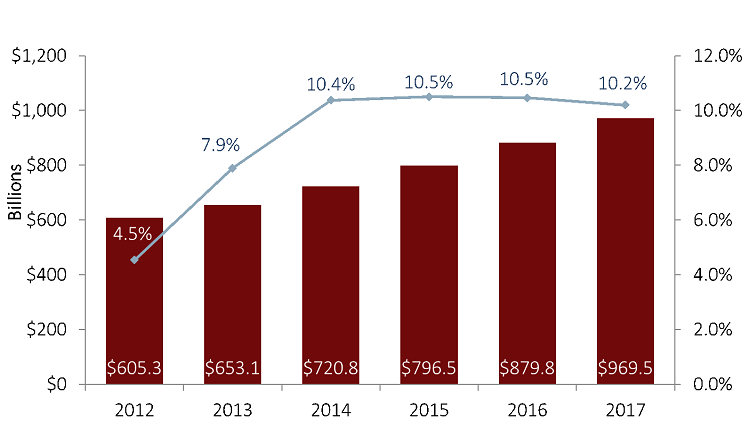
Deposits And Loans
Credit unions posted tremendous growth on both the deposit and lending sides of the portfolio 6.2% and 10.2%, respectively. Year-end loan growth has increased by double-digits for four consecutive year and has outpaced share growth for the past five years. This quarter’s loan-to-share ratio of 82.5% is the highest rate since 2008.
TOTAL LOANS AND ANNUAL GROWTH
FOR U.S. CREDIT UNIONS | DATA AS OF 12.31.17
ContentMiddleAd
Member Growth
Member growth increased 19 basis points in 2017. As of year-end, credit unions served 112.9 million members and returned $6.5 billion in the form of dividends that’s roughly $57.20 per person. That average member relationship increased 3.4% annually to $18,308.
Credit unions returned roughly $57.20 per member in 2017.
MEMBERSHIP AND ANNUAL GROWTH
FOR U.S. CREDIT UNIONS | DATA AS OF 12.31.17

Auto Lending
The credit union share of the auto finance market reached 19.2% as of Dec. 31, 2017. That’s an annual increase of 1.2 percentage points. With 11.5% year-over-year growth, auto loans were the fastest growing loan segment in the credit union portfolio. Indirect loans grew 17.8% annually. At year-end, these loans comprised 58.2% of the auto lending portfolio and 20.2% of all credit union loans.
Asset Quality
Total delinquency at credit unions was up 1 basis point over last year to 0.84% as of fourth quarter 2017. Of note, credit card delinquency increased 15 basis points year-over-year to 1.29%.
Earnings
NET INTEREST MARGIN VS. OPERATING EXPENSE
FOR U.S. CREDIT UNIONS | DATA AS OF 12.31.17

The earnings gap at credit unions shrank, with the operating expense ratio (3.09%) just 10 basis points above the net interest margin (2.99%) at year-end 2017. This is the tightest spread since 2004.
Catch Up On 4Q 2017 Trendwatch
This must-attend quarterly event for credit union leaders covers performance trends, industry success stories, and areas of opportunity. Attendees will find insight they won’t find anywhere else weeks before the official NCUA data release.