Numbers don’t lie, but they don’t always paint the whole picture, either.
Slicing and dicing data in a new way can reveal new insights. Take non-interest income (NII) as an example.
All credit unions need a steady flow of NII to supplement what they make from interest on loans and investments.
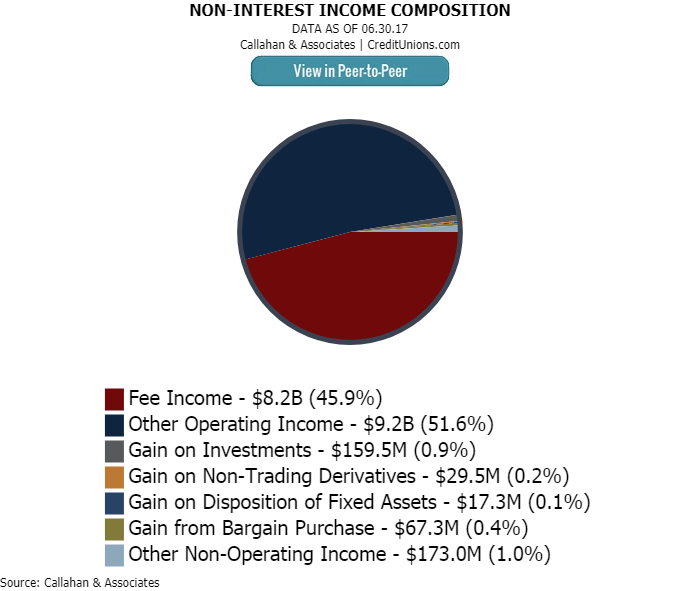
Non-interest income, per the NCUA, comprises fee income (overdraft, ATM, credit card fees, etc.), other operating income (unconsolidated CUSO income, NCUSIF dividends, interchange income, participation loans, etc.), gains on investments, gains on non-trading derivatives, gains on disposition of fixed assets, gains from bargain purchase (typically mergers), and other non-operating income (gifts, donations, grants).
The chart titled Non-Interest Income Composition shows each NII category sized in proportion to its dominance on the balance sheet. The data is for all credit unions as of second quarter 2017.
 Although every credit union has its own mix of those revenue streams, there are some commonalities across institutional sizes. ContentMiddleAd
Note, fee income and other operating income are huge.
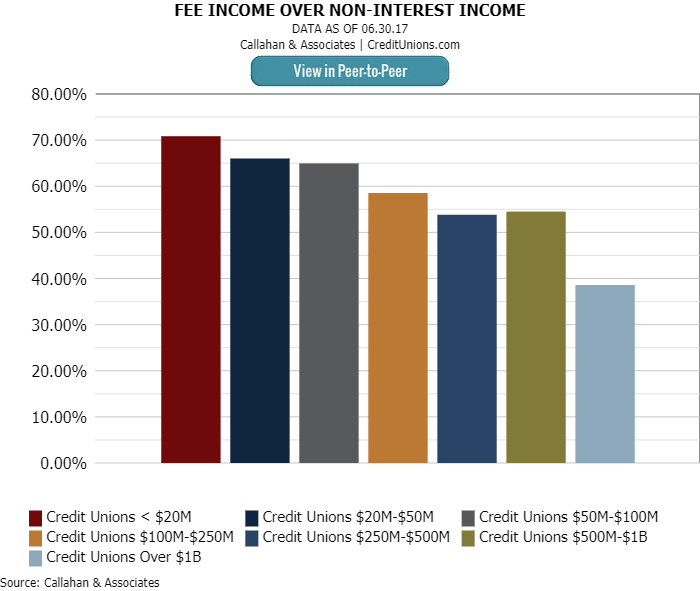
The graph titled Fee Income Over Non-Interest Income shows that credit unions with less than $20 million in assets generate 70.9% of their NII from fees. That ratio goes down as the size goes up. Billion-dollar credit unions generate only 38.8% of their NII from fees.
Fee income is a hot-button issue, seen as some industry leaders are more punitive especially as they relate to things like overdraft fees than valuable member service, and these graphs could suggest smaller credit unions live more off fees than their larger brethren.
But in reality, that’s not necessarily true.
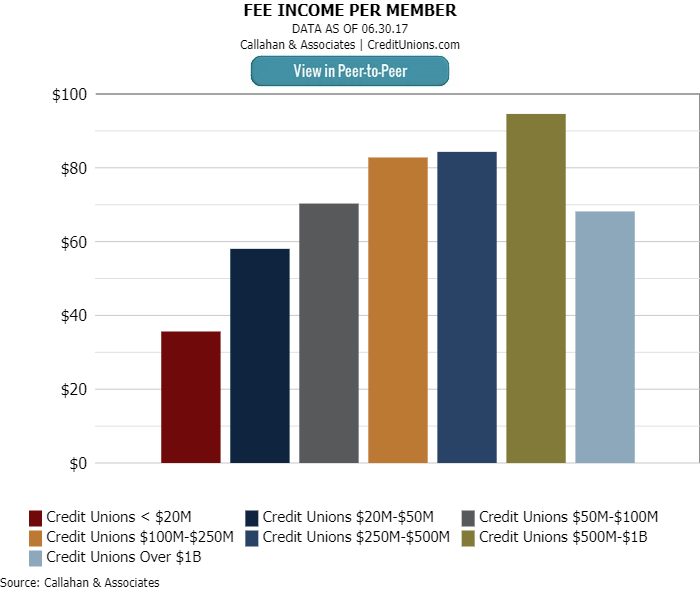
The graph titled Fee Income Per Member shows that the smallest group has an annualized average of $36 per member that’s the lowest among any asset band. The highest is $95, which is for the $500 million to $1 billion peer group.
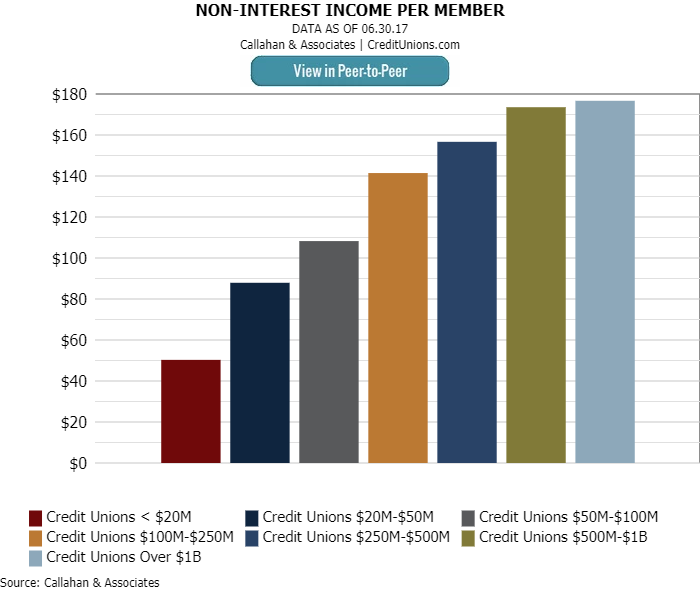
In the chart titled Non-Interest Income per Member, the relationship is a straight line up by asset size, from $50 of NII per year per member for the smallest credit unions to $177 per member for the big guys.
 So, what’s going on?
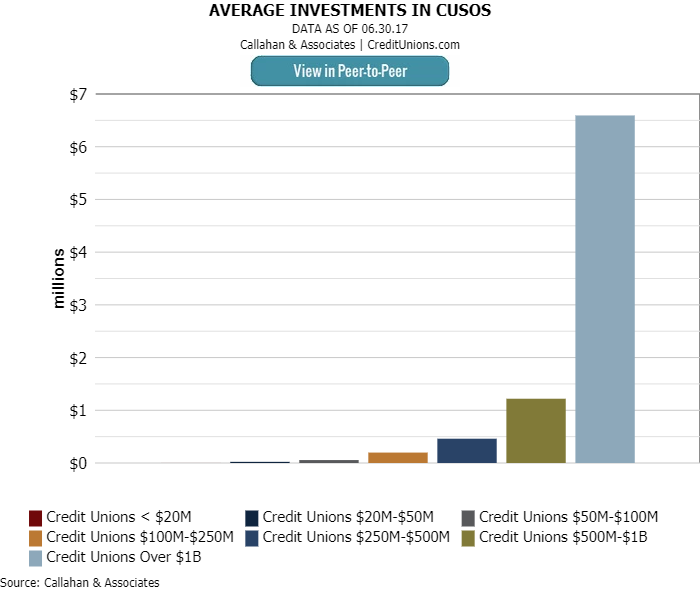
For starters, larger credit unions tend to be involved in more things that generate income outside the loan portfolio. A good example: CUSOs. Income from CUSO activity is a major component of other operating income. In the chart titled Average Investment In CUSOs, the billion-dollar credit unions have an average investment of $6.6 million each. That shrinks to almost nothing on average for the smallest cooperatives.
 Also, consider the different role NII plays in return on assets, which is a fundamental measure of financial performance.
The earnings model table displayed here shows ROA for each asset band. The chart annualizes the figures for each element and divides by average assets. Interest income and interest expense is followed by the third row, which subtracts interest expense from interest income to get the net interest margin. From there, non-interest income is added and operating expense and provision expense are subtracted. That rolls up into ROA.
EARNINGS MODEL
FOR U.S. CREDIT UNIONS | DATA AS OF 09.30.17
© Callahan & Associates | www.creditunions.com
| Name | Credit Unions < $20M | Credit Unions $20M-$50M | Credit Unions $50M-$100M | Credit Unions $100M-$250M | Credit Unions $250M-$500M | Credit Unions $500M-$1B | Credit Unions > $1B |
|---|---|---|---|---|---|---|---|
| Interest Income | 3.44% | 3.29% | 3.37% | 3.46% | 3.45% | 3.48% | 3.48% |
| Interest Expense | 0.30% | 0.30% | 0.31% | 0.35% | 0.40% | 0.43% | 0.62% |
| Net Interest Margin | 3.14% | 2.99% | 3.06% | 3.11% | 3.05% | 3.05% | 2.85% |
| Non-Interest Income | 0.81% | 1.05% | 1.20% | 1.41% | 1.48% | 1.47% | 1.30% |
| Operating Expenses | 3.56% | 3.49% | 3.63% | 3.67% | 3.58% | 3.47% | 2.75% |
| Provision For Loan Losses | 0.25% | 0.25% | 0.31% | 0.35% | 0.37% | 0.44% | 0.47% |
| ROA | 0.14% | 0.30% | 0.32% | 0.49% | 0.58% | 0.60% | 0.93% |
Source: Callahan & Associates.
The table shows that NII tends to play a larger role in ROA for larger credit unions it’s 1.30% of average assets for the largest credit unions but only 0.81% for the smallest.
What does this all mean?
Never judge a book by its cover. Each credit union has its mix of ways to make money while being member-friendly. As long as they do that, it all adds up.
How Do You Generate Non-Interest Income?
Non-interest income is an essential supplement to loan interest and investments. Find out if your credit union could be generating more and compare your strategy against peers using Callahan’s analytics software.

This article appeared originally in the Credit Union Times in November 2017.