The credit union industry’s loan-to-share ratio peaked at 83.7% in the third quarter of 2008. After the Great Recession, the movement’s loan-to-share ratio dropped dipping all the way to 65.9% in the third quarter of 2013. Since then, however, the ratio has gradually rebounded and hit 82.5% at year-end 2017.
LOAN-TO-SHARE RATIO
FOR U.S. CREDIT UNIONS* | DATA AS OF 12.31.17
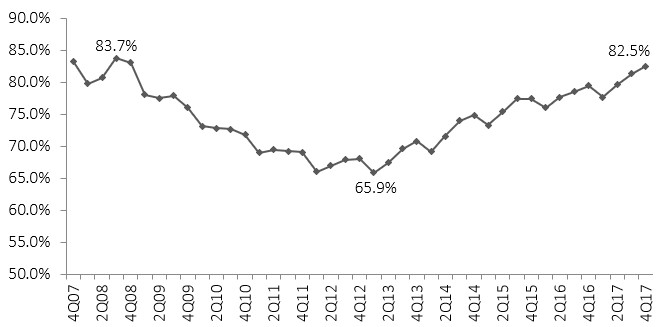
*For 5,589 credit unions
Source: Callahan & Associates
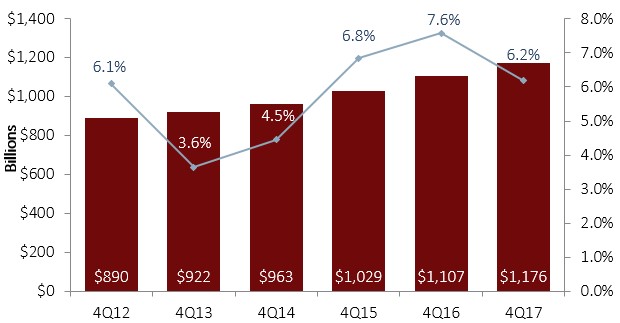
Fueled by 14 consecutive quarters of double-digit loan growth, the industry’s LTS ratio continued its ascent as loan growth outpaced share growth. Annual loan growth decelerated slightly to 10.2% as of the fourth quarter, and share growth slowed to 6.2%. Despite year-over-year growth slowing on both sides of the balance sheet, balances still increased. ContentMiddleAd
TOTAL LOANS AND YEAR-OVER-YEAR LOAN GROWTH
FOR U.S. CREDIT UNIONS* | DATA AS OF 12.31.17

*For 5,589 credit unions
Source: Callahan & Associates
TOTAL SHARE BALANCES AND YOY SHARE GROWTH
FOR U.S. CREDIT UNIONS* | DATA AS OF 12.31.17
*For 5,589 credit unions
Source: Callahan & Associates
According to the National Bureau of Economic Research, an economic expansion is a period when economic activity rises substantially, spreads across the economy, and typically lasts for several years.
The United States has been in a sustained expansionary phase since the 2008-2009 recession; however, this prolonged length might be causing unease. The chart below depicts the GDP-Based Recession Indicator Index. This index measures the probability that the U.S. economy is in a recession. When the value of the index rises above 67%, it is a historically reliable indicator that the economy has entered a recession. Once passing the threshold, falling below 33% indicates the recession has ended.
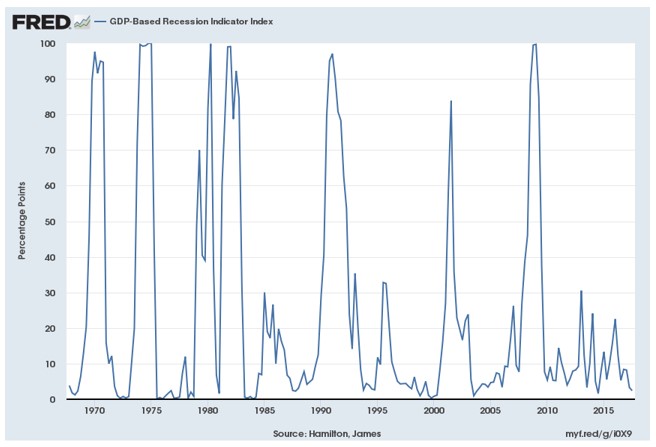
For perspective, during the Great Recession, the index peaked at 99.7% and then dropped to around 30%. Before 2009, the longest expansion since 1945 was 120 months, which occurred between 1991 and 2001. Now, the United States has surpassed 102 months of expansion in an environment where the average economic cycle period is 58.4 months. According to Ardavan Mobasheri, chief investment officer of ACIMA Private Wealth, history suggests a recession is near.
When the economy is running at full speed as it is today, with little slack in the labor markets and with confidence levels at or near all-time highs and valuations stretched across equity sectors, shocks that may have had little impact on the economy during the early years can derail the whole thing now, writes Mobasheri in an op-ed for CNBC.
So, today’s concern isn’t about the levels on the index but rather the time in-between economic downturns.
Liquidity and asset-liability management have been hot topics as credit unions try to maintain a healthy, sustainable balance between loans and shares. A credit union can interpret being too loaned out in numerous ways depending on business models, initiatives, and other factors. Despite the industry’s LTS ratio nearly reaching pre-recession levels, credit union financial performance continues to thrive.
This article isn’t meant to imply a downturn is forthcoming. Rather, it is an informational piece that highlights broader economic performance and historical industry metrics. And keeping abreast of industry trends and economic indicators such as these helps credit unions adjust to the unpredictable financial environment in which they operate.