Share balances at U.S. credit unions have grown at near-record rates since the onset of COVID-19 and the resulting lockdowns. According to second quarter data from Callahan & Associates representing 99.6% of industry assets deposit balances at credit unions increased 16.5% year-over-year. This is the fastest annual rate since 2003. Meanwhile, total loan balances rose 6.6%. Together, these top-level dynamics have driven down the industry’s loan-to-share ratio to 76.2% the lowest level since the first quarter of 2016.
LOAN-TO-SHARE RATIO
FOR U.S. CREDIT UNIONS | DATA AS OF 06.30.20
Callahan & Associates | CreditUnions.com

The industry’s loan-to-share ratio usually increases between March and June, but heavy share growth has prolonged what is usually a seasonal decline.
The Impact Of COVID-19 On Liquidity
In mid-March, when the uncertainty surrounding COVID-19 was near its peak, it didn’t seem likely the industry would report substantial balance sheet growth during the coming months. However, federal relief programs, a dovish Fed monetary policy, and lenient loan forbearance programs all have aided the U.S. economy. Funds from personal aid checks and increased unemployment have flooded into deposit accounts, and many workers are still earning income while working from home.
Additionally, quarantines and small business closures have dramatically reduced consumer spending. Consumer originations were down 0.2% year-to-date from June 30, 2019, and overall credit card balances were down 2.4% annually, the first outright decline since 2003. Historically low interest rates did drive a 94.1% year-over-year increase in first mortgage originations, which, in turn, helped prop up overall loan growth, mainly via refinances.
However, stimulus income combined with slowed consumer spending left a lot of new money sitting in deposit accounts. Share drafts and regular shares were up 27.3% and 19.0%, respectively, as of June 30. These are the highest rates for both categories in more than 15 years.
12-MONTH SHARE GROWTH BY TYPE
FOR U.S. CREDIT UNIONS | DATA AS OF 06.30.20
Callahan & Associates | CreditUnions.com

Share growth has accelerated across most account types over the past year. Share certificates the hot commodity of recent periods was the lone exception. Growth there slowed under pressure from the low interest rate environment.
6-MONTH SHARE CHANGE BY TYPE
FOR U.S. CREDIT UNIONS | DATA AS OF 06.30.20
Callahan & Associates | CreditUnions.com

Regular shares and share drafts made up 82% of all new share deposits over the first six months of 2020.
In today’s environment of increased deposit balances and low interest rates, credit unions have favored holding unlent funds in accessible cash versus investing in options such as Treasuries and their historically low yields. All told, cash and equivalents balances were up 78.6% annually as of June 30, effectively alleviating the liquidity concerns that were widespread in the second half of 2019.
Spread compression and a corresponding decline in net income have replaced last year’s liquidity fears. Sudden rate cuts drove the industry’s net interest margin down 31 basis points to 2.87%, the largest 12-month decline of this century. Year-to-date income from investments, hindered by the low-yielding cash balances, fell 20.4% annually, significantly impacting credit union earnings. As a result, credit union net income totals declined 34.8% year-over-year. This combined with the increase in investment asset balances drove the industry’s net worth ratio down to 10.5%, 92 basis points below the decade-long high reported this past December. Since last quarter, 80 credit unions fell below the NCUA’s well-capitalized ratio of 7%.
NET INTEREST MARGIN VS. OPERATING EXPENSE RATIO
FOR U.S. CREDIT UNIONS | DATA AS OF 06.30.20
Callahan & Associates | CreditUnions.com
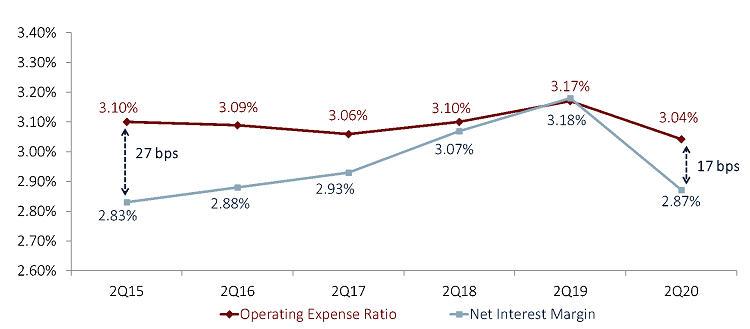
In the second quarter of 2019, the net interest margin overtook the operating expense ratio, meaning credit unions could cover day-to-day expenses using only interest income. Thanks to spread compression, that is no longer the case.
Loan Forbearance And Asset Quality
A review of credit union income statements does detract from the more optimistic balance sheet results; however, these top-level metrics underscore many positive trends, namely that credit unions are supporting their members during this pandemic.
All told, the industry’s net income was down $2.5 billion annually, to $4.7 billion year-to-date. However, much of this decline can be attributed to a 51.7% increase in the provision for loan loss. With a year-to-date total of $4.9 billion, the industry’s total provision expense was up $1.7 billion versus last year and accounted for 65.9% of the total decline in net income.
In short, income streams are not performing as poorly as they might seem. Instead, credit unions are strategically repurposing income to help members in need. The increase in provision expense has pushed the industry’s allowance for loan and lease losses up 21.4% annually to $11.5 billion, the highest level on record. With total delinquent loans actually down 2.2%, the nationwide coverage ratio the amount of allowance for every dollar of delinquent loans increased to the highest it has ever been, 172.2%.
COVERAGE RATIO
FOR U.S. CREDIT UNIONS | DATA AS OF 06.30.20
Callahan & Associates | CreditUnions.com

Large increases in the allowance for loan loss and a decline in delinquent loan balances resulting from increased forbearance policy drove the coverage ratio to an all-time high.
QUARTERLY PROVISION FOR LOAN AND LEASE LOSSES
FOR U.S. CREDIT UNIONS | DATA AS OF 06.30.20
Callahan & Associates | CreditUnions.com
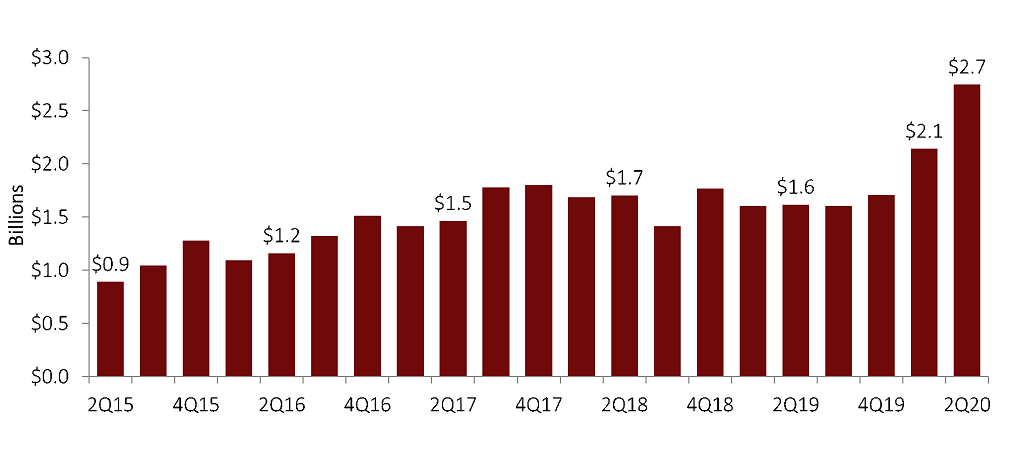
Credit unions allocated $2.7 billion to their provision between April and June 2020, the most in a single quarter on record.
ALLOWANCE FOR LOAN AND LEASE LOSSES
FOR U.S. CREDIT UNIONS | DATA AS OF 06.30.20
Callahan & Associates | CreditUnions.com

Credit unions are storing the additional provision expense in the allowance segment of their balance sheets, which also has reached an all-time high.
ASSET QUALITY RATIO: NET CHARGE-OFF RATIO + DELINQUENCY RATIO
FOR U.S. CREDIT UNIONS | DATA AS OF 06.30.20
Callahan & Associates | CreditUnions.com

Government economic programs and credit union generosity have worked together to improve asset quality, although this might be short-lived.
It is important to examine loan delinquency and the reason behind its decline. Certainly, government stimulus and increased unemployment benefits have played a crucial role in keeping delinquency and charge-offs down. However, relaxed loan forbearance policies at credit unions across the country also have been a major factor.
Spurred by government incentives under the CARES Act, as well as an obligation to the credit union mission of member support, cooperatives have deferred payment on billions of dollars of loans, providing members with some peace of mind during this difficult time. Although credit unions are preparing for these deferred loans to come due, the goodwill generated from these policies could prove invaluable toward ongoing member engagement.
Increasing Member Access To Credit
Credit unions aren’t just setting aside money to cover potential future losses; they also are deploying capital in other ways to benefit their members. For example, many are increasing lines of credit as well as reducing fees which were down 9.7% annually.
Although loan balances for revolving credit cards fell 2.4% year-over-year, the total amount available grew 8.4%. To give members in need access to quick cash, Wright-Patt Credit Union ($5.7B, Beavercreek, OH), added $1,000 of credit to every member’s credit card line. Other credit unions have applied similar generous policies.
TOTAL LINES OF CREDIT AND CREDIT CARD UTILIZATION
FOR U.S. CREDIT UNIONS | DATA AS OF 06.30.20
Callahan & Associates | CreditUnions.com

Although many members are using their credit cards less, there is a segment of members desperate for extra credit and many others might need it in the near future.
Not all credit unions are willing to extend this additional unsecured credit, opting instead to hold these riskier loans at their current level. This consideration is important to acknowledge, as a potential surge in delinquencies could leave credit unions overextended, even with a substantial allowance for loan loss. However, the industry is expanding lines of credit in other ways, too.
Total revolving open-end real estate LOCs most often HELOCs were up 3.6% annually despite a 2.3% annual decline in draws. Overall, unfunded commitments for all loan types at credit unions across the country have increased 11.6% year-over-year. Some of this growth can be attributed to a decline in spending and utilization, but additional access to credit also is a significant part of the equation. The overall surge in deposit balances and decline in spending shows not all members need this additional access to cash. However, some members do and countless others might soon, especially if aid and welfare programs slow down or disappear.
The Bottom Line
Safety measures and aid packages introduced to combat COVID-19 have resulted in liquidity across the credit union industry reaching potentially unwanted levels. However, a combination of increased credit lines, low interest rates, and a more optimistic outlook for economic reopening should incentivize future spending and help credit unions recover from current net worth pressures.
The delinquency rate deserves close monitoring during the next few quarters, but many institutions have the allowance balances available to cover even a significant increase in loan losses. It will be a tight rope to walk in these uncertain times, but if credit unions can keep deploying excess liquidity to support members while covering their downside risk, the movement will come out of the pandemic having garnered significant goodwill from a membership in need.