The stock market reached record highs in the fourth quarter, reflecting strong earnings and market sentiment at year-end. However, there is growing evidence the country is experiencing a K-shaped recovery in which some groups often those who can work virtually rebound quickly, whereas others are not so fortunate. The federal government has issued rescue packages to assist struggling demographics, and the Federal Reserve is keeping interest rates at record lows to spur consumer spending and borrowing. In this tight-rate environment, financial institutions must work to maintain operating spreads while balancing the increasingly diversified needs of their customers.
Key Points
- Total revenue at U.S. credit unions increased 1.1% only annually. Yields fell faster than the cost of funds, and interest income decreased 1.9% year-over-year to $60.8 billion. This is the first calendar-year decline since 2013.
- Total operating expenses increased 5.9% annually to $51.9 billion as of year-end, outpacing revenue growth. Consequently, net income at U.S. credit unions decreased 15.1% year-over year. Still, credit unions worked hard to cut costs as closed branches and slowed operations contributed to the slowest rate of expense expansion since 2017.
- Non-interest income increased 11.2% year-over-year to $23.9 billion. Fee income declined 10.1% annually as credit unions prioritized member relief. Other operating income, made up largely of secondary sales and interchange income, increased 25.9% and fueled non-interest income growth during the year.
Click the tabs below to view graphs.
RETURN ON ASSETS
RETURN ON ASSETS
FOR U.S. CREDIT UNIONS | DATA AS OF 12.30.20
Callahan & Associates | CreditUnions.com
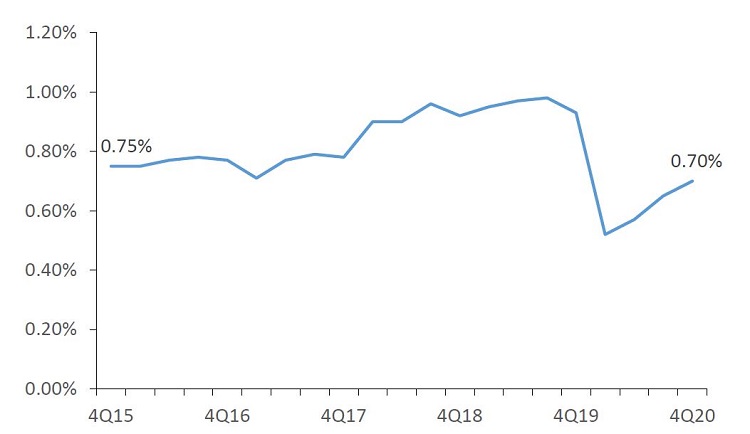
ROA increased 5 basis points during the quarter as credit unions adapted their earnings models to accommodate the economic fallout from COVID-19.
NET INTEREST MARGIN VS. OPEX
NET INTEREST MARGIN VS. OPEX
FOR U.S. CREDIT UNIONS | DATA AS OF 12.30.20
Callahan & Associates | CreditUnions.com
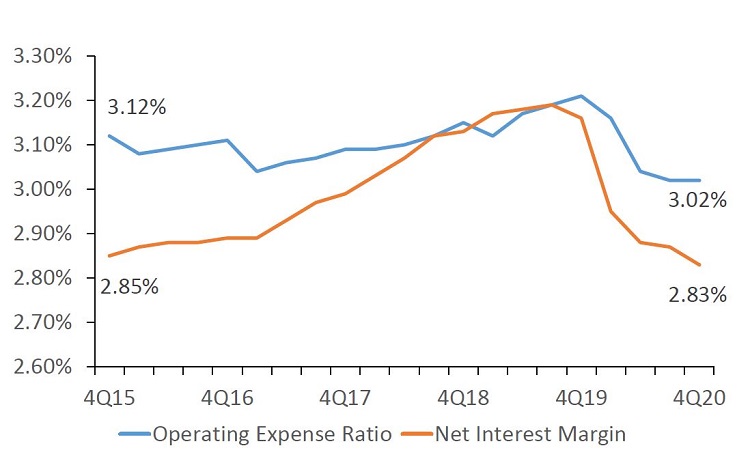
The gap between the net interest margin and the operating expense ratio expanded 14 basis points year-over-year to 19 basis points. To cover expenses, credit unions increased non-interest income, which was up 11.2% annually.
REVENUE AND ANNUAL GROWTH
REVENUE AND ANNUAL GROWTH
FOR U.S. CREDIT UNIONS | DATA AS OF 12.30.20
Callahan & Associates | CreditUnions.com
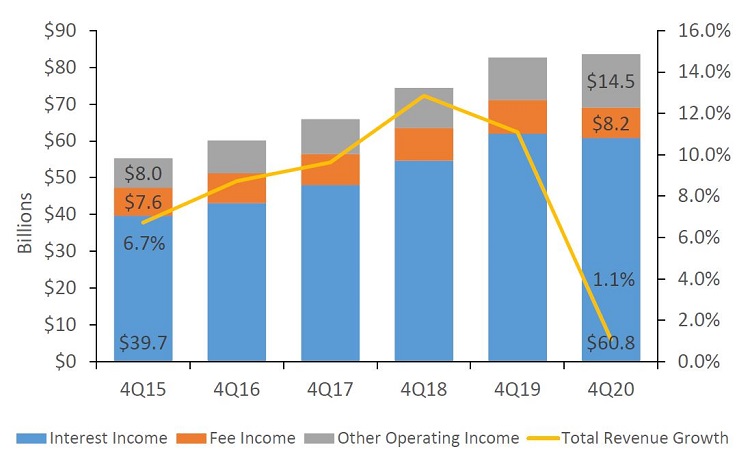
Interest rate pressures depleted interest income, forcing credit unions to look to other operating income made up largely of interchange and sales to secondary markets to bolster revenue.
The Bottom Line
Credit union earnings rebounded toward the end of the year despite the Federal Reserve holding interest rates at record lows. To overcome earnings challenges resulting from compressed margins, credit unions turned to non-interest income streams, particularly mortgage sales to secondary markets. Institutions also considered their strong asset quality and accordingly decreased their provision allocation, which was $830.1 million lower in the fourth quarter than in the third. These strategic pivots kept revenue growth positive during the year, and drove a 5-basis-point increase in ROA across the fourth quarter. Credit unions are finding ways to adapt their business models to the changing economic landscape.
This article appeared originally in Credit Union Strategy & Performance. Read More Today.
Customize A Data Scorecard With 4Q20 Data
Pick 10 ratios most important to your credit union and we’ll compare you to relative credit union and banking peers using 4Q data.
Learn More ![]()