Top-Level Takeaways
-
Credit card utilization rates stay the same, even when available credit increases, resulting in higher balances.
-
Credit union credit card utilization was 31.0% in first quarter 2017.
-
A jump in charge-offs to 2.57% in the first quarter could suggest cardholders are struggling to pay off credit card debt.
Credit card usage among credit union members is not going the way of the dinosaur, even if by one measure it does chart like a stegosaurus.
A graph depicting the percentage of credit card loans as part of the overall credit union loan portfolio credit card loans over total loans trends up and down and evokes the spikey-spine beast of the past. The rises, which occur every fourth quarter of the year, reflect increased usage during holiday spending. After the shopping spree, reality sets in and credit card balances drop as tax returns help people pay off debt.

First quarter numbers from the year 2007 until 2015 show credit card spending has risen slightly relative to the entire loan portfolio, but that’s only part of the story. There’s also a steady rise in balances and what might be the beginning of a spike in difficulties paying off debt.

Understandably, credit card debt charge-offs hit a high of 4.57% in the first quarter of 2010, the depth of the Great Recession. Those charge-offs came on the heels of a major spike in credit card delinquencies, which hit 2.02% in the fourth quarter of 2009. Both those measures fell as the economy improved.
Curious How Your Credit Card Lending Compares?
The graphs in this article were pulled from Callahan’s Peer-to-Peer software. Credit unions like yours can use Peer-to-Peer to quickly benchmark how their credit card efforts compare to their credit union peers.
![]()
But charge-offs have jumped sharply again, hitting 2.57% in the first quarter of 2017. Delinquencies, meanwhile, rose slightly and then headed back down.

Perhaps this is the result of credit unions moving bad debt off their books, or perhaps it’s a sign of something more.
Credit card use is growing along with everything else in the movement, including membership, mortgages, overall lending, and shares. Share draft penetration has hit 56.5%. Auto loan and credit card penetration are also up. Real estate penetration is down slightly from past years, although first mortgage share of the overall market is at an all-time high. ContentMiddleAd
Credit card utilization at credit unions, although not at an all-time high, is substantial. Ten years ago, the industry’s collective members used 27.7% of their $8.4 billion in available credit. Today, they use 31.0% of $19.8 billion in available credit. Utilization rates reached 32.2% in 2013 but gradually descended as the amount of available credit ? including unfunded commitments ? rose sharply. During the recovery, creditors offered consumers bigger chances to go deeper in debt.
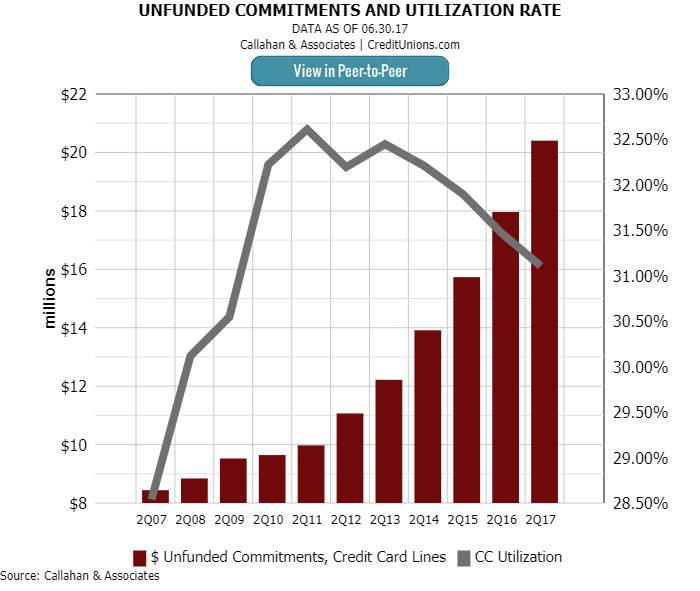
The result? We can see that even as unfunded commitments have gone up, utilization has stayed about the same. That means higher average balances, which indeed have risen from $2,138 in the first quarter of 2007 to $2,770 in the first quarter of 2017. That’s higher than the rate of inflation.

Could all this have something to do with the sudden rise in net charge-offs and smaller but still notable increase in delinquencies? Is the economy the macro reason? What’s going on here? Only time will tell.
This article appeared originally in the Credit Union Times in July 2017.