Total mortgage originations in the U.S. peaked in the fourth quarter of 2020 at $1.3 trillion. Credit unions shared in the bountiful mortgage market, as the cooperative finance industry had its two best origination years on record in 2020 and 2021. However, mortgage lenders have faced headwinds from rising rates and limited supply in recent quarters, and from a dollars perspective, generations have contracted by nearly half on a quarterly basis since those mid-pandemic surges.
Residential mortgage originations for the entire United States slowed to $689 billion in the first quarter of 2022. This is down from $893 billion in the previous quarter, according to the Mortgage Bankers Association. Of these originations, credit unions generated about $58.1 billion in residential first mortgages, good for an 8.5% market share. Total real estate originations including HELOCs, second mortgages, and commercial loans were $85.5 billion through March for U.S. cooperatives, 2.3% higher than in the first quarter last year.
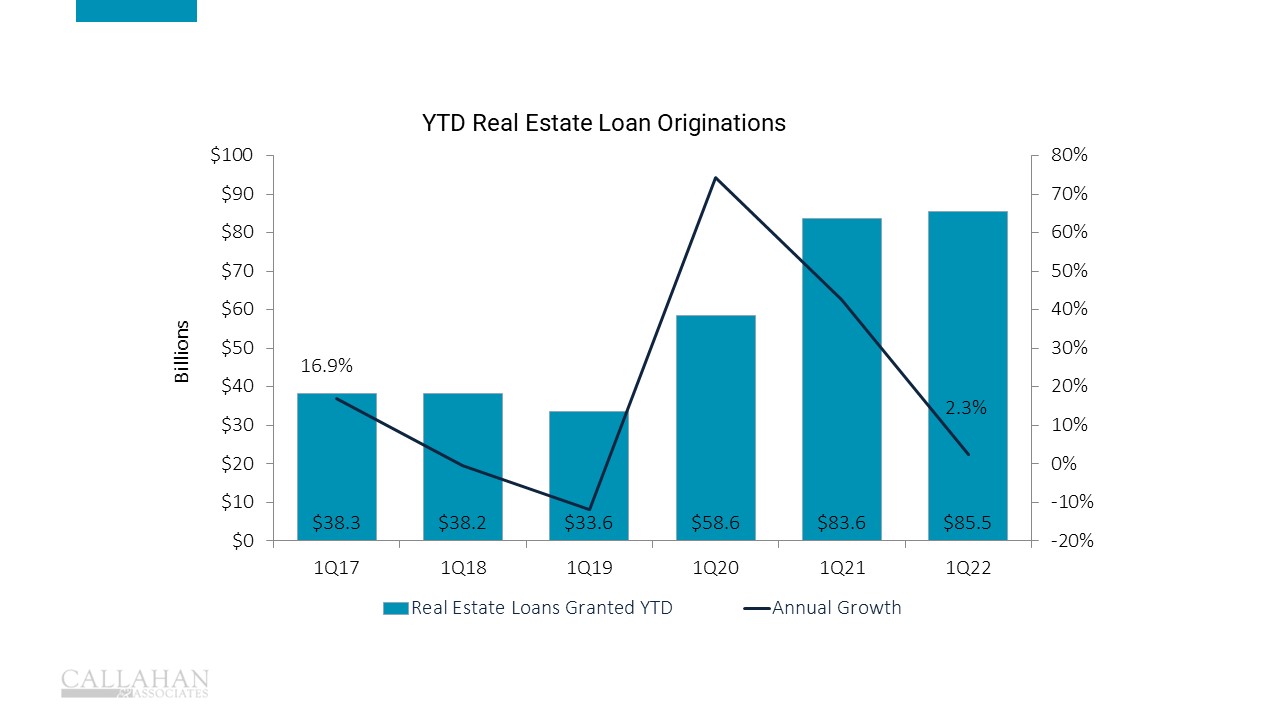
AFTER BOOMING IN 2020 AND 2021, REAL ESTATE ORIGINATION GROWTH SLOWED TO 2.3% IN THE FIRST QUARTER FOR U.S. CREDIT UNIONS
To understand the paths the mortgage market might take going forward, it’s important to understand the industry’s recent history. In the years leading up to the 2007-2008 housing bubble, U.S. builders constructed homes at a pace way above the historical average. From 2000 to 2007, there were an average of 1.4 million single family housing starts per year, or new homes that began construction, according to the U.S. Census Bureau. That’s roughly 300,000 above the average for the few decades prior. Housing was booming, and builders took advantage by building as fast as possible. That all ended when the real estate bubble burst in 2008. Home values plummeted and foreclosures were rampant.
Years of oversupply in the early 2000s, followed by a negative-demand shock in 2008, made for a post-crisis housing market that lacked the incentives to build homes. It took years to chew through the excess inventory stacked up during the glut. From 2008 to 2021, an average of 714,000 single family homes were started each year, half of the pace from before the crisis, according to Census Bureau data. While trying to avoid a repeat of the over-supplied bubble, the market overcorrected in the opposite direction.
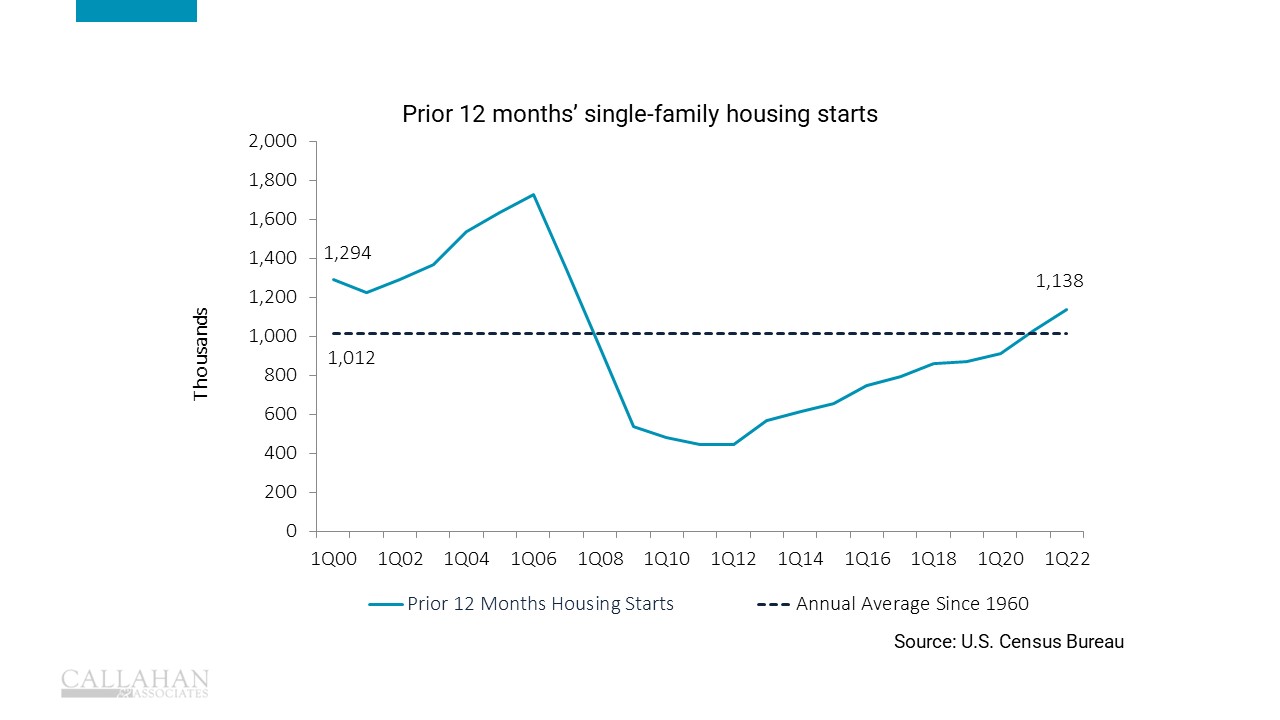
OVER THE LAST DECADE, THE U.S. BUILT SINGLE FAMILY HOMES AT A PACE WELL BELOW THE HISTORICAL AVERAGE
The Pandemic’s Impact
In March 2020, cities locked down and people began working remotely, traveling less, and staying home more. As a result, families needed more space, and remote work allowed many city dwellers to relocate to suburbs and rural areas. Additionally, adult children living with their parents decided it was time to move out, and historically low interest rates made purchasing a home attractive.
In addition to the need for space, Americans used the remote work opportunity to move away from high cost of living (COL) urban areas. The Northeast region saw a negative net migration from April 2020 to July 2021, with a net 413,000 people flowing to other areas of the country, according to the Census Bureau. The Midwest had a net migration of -133,000, followed by the West with -102,000. California alone had 416,000 people depart for other states, which resulted in a substantial positive net migration for other states in the region. The South ‘ which has a lower COL than the national average ‘ was the biggest recipient, with a net migration of 904,000 over the same period.
While a car can be moved anywhere across the country, a house is stationary. The U.S. entered the pandemic without enough homes, and intense inter-state migration meant that existing homes were no longer in the correct places. As of March 31, 2022, there were only 382,000 active home listings in the U.S., down from the seasonal norm of about 1.1 million listings, according to realtor.com. The supply shortage was more pronounced in the South and Southwest, demonstrated by active home listings deviating even farther from the historical average compared to the country as a whole. These dynamics created a massive supply-demand imbalance in many areas, and home prices have reacted accordingly. From March 31, 2020, to March 31, 2022, the median listing price of a home in the U.S. increased 26.5% to $404,950, according to realtor.com.
Even though the Northeast and California experienced net outflows overall, there were still migration dynamics within the region that drove up overall home prices. Urban renters moved to the suburbs to buy homes, driving up real estate prices in these desirable neighborhoods, especially around the coasts. However, the price increases were relatively less pronounced than in the South, mainly due to headwinds from the overall migration factors. Active home listings in cities like New York, San Francisco, and Los Angeles did not drop as severely as southern cities like Austin, Tampa and Phoenix, where new offerings were gobbled up quicker. The Northeast and California have more homes available for sale, relatively speaking, and prices in the highest cost of living areas which had outflows of people are moderate when compared to the South and Southwest.
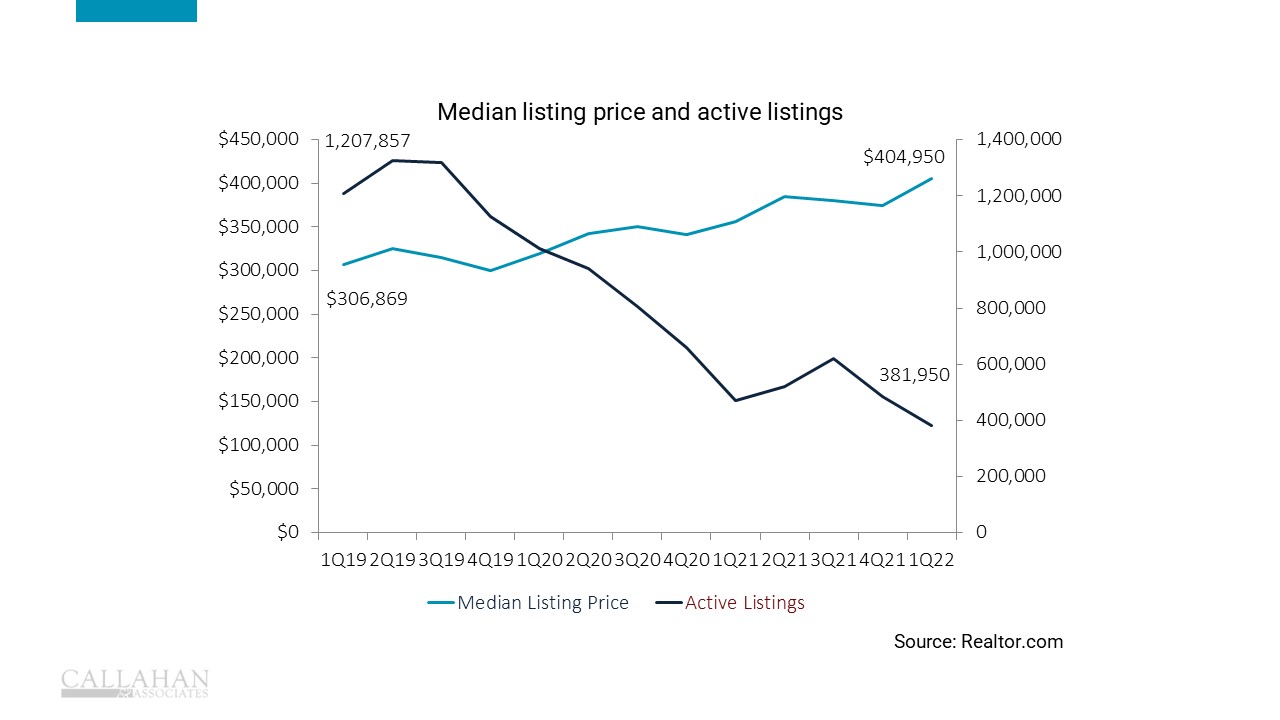
THE NUMBER OF HOMES ON THE MARKET DECREASED 68.4% SINCE MARCH 2019, LEAVING THE COUNTRY WITH ONLY 381,950 HOMES AVAILABLE AS OF MARCH 2022
Unemployment is at 3.6% nationally as of March 31, wages are rising, and savings balances are higher than ever. Home-shoppers feel equipped to buy instead of rent, but many remain priced out. If rates place headwinds on demand and supply starts to catch up, the possibility is there for home pricing to eventually normalize. Still, this normalization remains far off, based on current data, and credit unions must focus on finding ways to assist these priced-out home shoppers in the near term. Homebuyer-education programs may be more valuable than ever.
For existing homeowners, rising rates have already impacted refinances, which made up just 45% of national mortgage originations in the first quarter ‘ the lowest portion since the third quarter of 2019. Credit unions may have an opportunity with existing homeowners in the form of second liens. Rather than moving to a new home ‘ which may be too expensive for many ‘ a homeowner may look to tap into found equity to expand or remodel their current home. This dynamic is already playing out, as second-lien balances outstanding increased $4.2 billion annually.
For reasons of both supply and demand, a housing market downturn is unlikely in the short-term. Rising home prices aren’t fueled by rampant speculation as they were in the 2008 bubble, but rather a straightforward supply and demand imbalance. Expect demand to remain sufficient and originations to rely more on the pace of homes being built. It took the U.S. years to work through the oversupply following the 2008 bubble, and that might be a road map for the undersupply in the current market. Some factors to keep an eye on include continued rate increases suppressing demand, the labor shortage relaxing, and easing complications along the construction supply chain. These combined elements will help builders get the necessary materials and labor to build homes and meet demand. Until these dynamics find balance, credit unions must focus on finding ways to support a membership that may be priced out of homeownership in many markets.