With 3,961 credit unions reporting second quarter data loaded into Callahan Associates Peer-to-Peer software, projections indicate that the overall delinquency ratio will continue down a familiar path, with a twist.
The overall delinquency ratio is projected to be 0.74% for all credit unions in the U.S. That figure is the exact same as the delinquency ratio for the second quarter of 2015 and a 3 basis point increase over the first quarter’s 0.71%.
OVERALL DELINQUENCY RATIO
For U.S. Credit Unions* | Data as of 06.30.16
Callahan Associates | www.creditunions.com
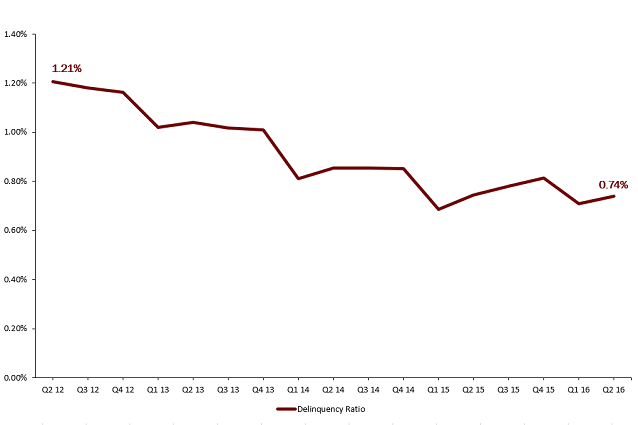
Source: Peer-to-Peer Analytics by Callahan Associates
*For 3,961 credit unions
For the past several years, the industry has seen a sharp decrease in the delinquency ratio between the fourth and first quarters followed by a gentle, steady increase until the next fourth quarter. This cycle continues into 2016; however, the rates for this year’s cycle are higher.
There’s the twist: The dip between the fourth and first quarter at the beginning of this year was the smallest since the Great Recession. It indicates that while the delinquency trends are following the same trajectory, the overall trend of year-over-year declining delinquency may be coming to a stop or at least a plateau.
First mortgage and auto loans make up the largest parts of the credit union loan portfolio, and their delinquent amounts drive the overall delinquency ratio. The first mortgage delinquency ratio is projected to be 0.65% for the second quarter of 2016, up 7 basis points from the year’s first quarter. Last year’s first mortgage delinquency in the second quarter was much higher at 0.80%, so it appears that other sources are pushing up the delinquency.
The most forceful driver is auto delinquency, which is projected to expand by 4 basis points year-over-year to 0.58%. Other delinquency rates, especially those from member business loans, student loans, and payday loans, are also creeping up preventing the overall delinquency from falling like it has in the past.
Credit union executives would be wise to monitor asset quality this quarter. By diving into risk factors and underwriting practices, they can work toward lowering their delinquency ratios.
BE SMART. ATTEND TRENDWATCH.
This must-attend quarterly event for credit union leaders covers performance trends, industry success stories, and areas of opportunity. Attendees will find insight they won’t find anywhere else weeks before the official NCUA data release.