Non-interest income comprising fee income, other operating income, and gains/losses from various investments can be tricky to maximize without raising fees. Some credit unions boost NII through sales of mortgages to the secondary market and unconsolidated gains from investments in CUSOs.
The table immediately below compares the national averages for several key business metrics to those of credit unions that have reported investments in CUSOs, and those that participate in the secondary market. These two qualifications clearly both have a positive effect on credit union earnings.
KEY BUSINESS METRIC PERFORMANCE
For all U.S. credit unions* | Data as of 12.31.15
© Callahan & Associates | www.creditunions.com
| All Credit Unions In The United States** | Credit Unions With Investments In CUSOs | Credit Unions With Sales To The Secondary Market | |
|---|---|---|---|
| Interest Income | 3.43% | 3.43% | 3.42% |
| Interest Expense | 0.53% | 0.54% | 0.54% |
| Net Interest Margin | 2.91% | 2.89% | 2.88% |
| Non-interest Income | 1.39% | 1.41% | 1.44% |
| Operating Expenses | 3.18% | 3.14% | 3.11% |
| Provision for Loan Losses | 0.35% | 0.37% | 0.34% |
| ROA | 0.77% | 0.79% | 0.86% |
*For all U.S. credit unions, credit unions with investments in CUSOs, and credit unions with sales to the secondary market.
**All values in table calculated as a percentage of average assets.
Source: Peer-to-Peer Analytics by Callahan & Associates
NON-INTEREST INCOME/AVERAGE ASSETS
For all U.S. credit unions | Data as of 12.31.15
© Callahan & Associates | www.creditunions.com
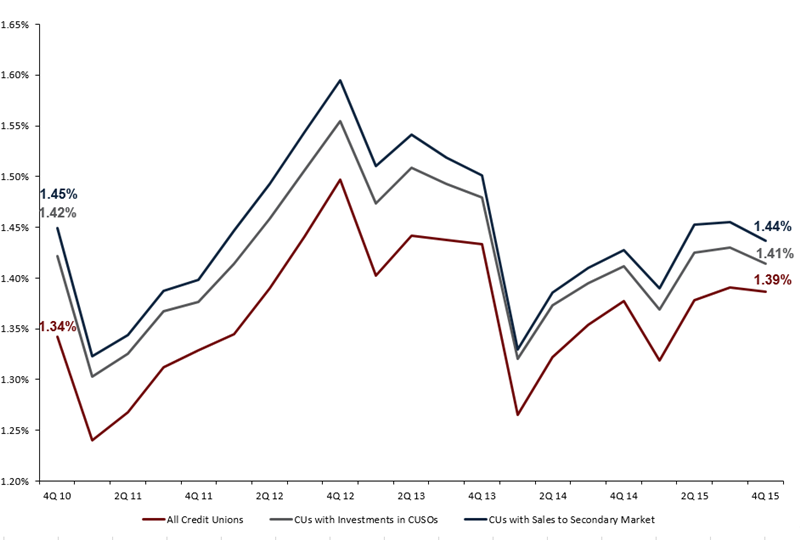
Source: Peer-to-Peer Analytics by Callahan & Associates
The boost in other operating income that credit unions gain from investing in CUSOs and selling to the secondary market helps keep these credit unions NII ratio consistently higher than the national average.
Other operating income rather than fee income is the main driver for non-interest income for these peers. In fact, the national average for other operating income to total non-interest income is 50.1%, while at credit unions with investments in CUSOs, that ratio is 52.0%, and at credit unions that participate in the secondary market, it’s 53.9%.
NON-INTEREST INCOME/MEMBER
For all U.S. credit unions | Data as of 12.31.15
© Callahan & Associates | www.creditunions.com
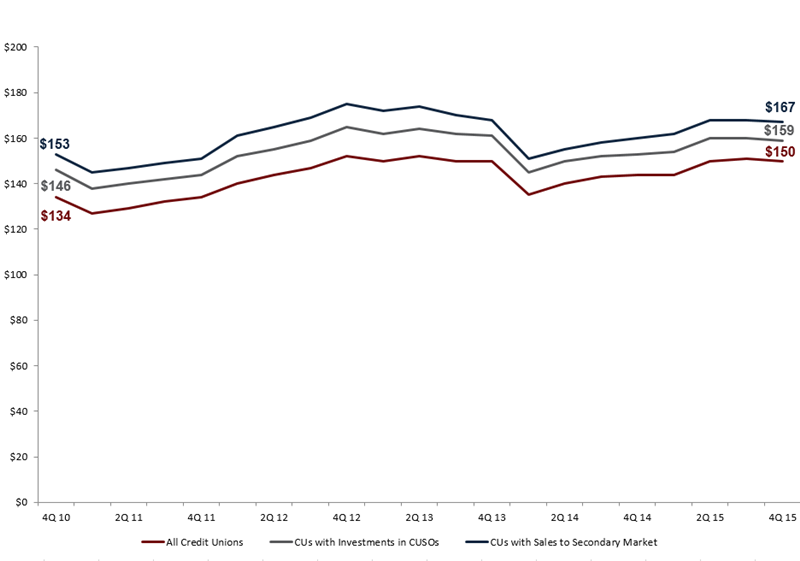
Source: Peer-to-Peer Analytics by Callahan & Associates
NII per member is higher at both credit unions that invest in CUSOs and those that sell to the secondary market. Participating in CUSOs and selling mortgages to the secondary market are both attractive approaches to increasing NII that can have positive impacts in other areas of the credit union’s business model, such as a more versatile balance sheet and lower overhead.
With increased pressure on credit unions to generate revenue, higher NII can be a way to diversify revenue streams and better fund operations.
You Might Also Enjoy
- A Strategy To Build Non-Interest Income One Transaction At A Time
- Sell Mortgages. Reap Non-Interest Income.
- Hype The Swipes To Boost NII