
Read the full analysis or skip to the section you want to read by clicking on the links below.
LENDING AUTO LENDING MORTGAGE LENDING CREDIT CARDS MEMBER BUSINESS LENDING SHARES INVESTMENTS MEMBER RELATIONSHIPS EARNINGS SPECIAL SECTION: PRODUCTIVITY EFFICIENCY
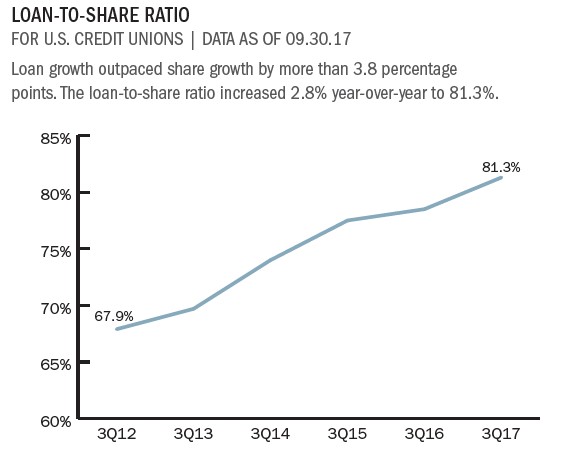
Shares for U.S. credit unions neared $1.2 trillion at the end of the third quarter. Annual growth as of Sept. 30, 2017, exceeded 5.7%. Although this was positive, share growth was 1.9 percentage points slower than last year’s 8.6% rate.
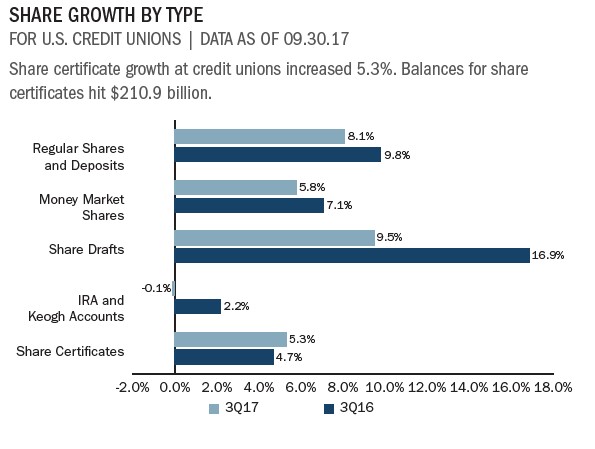
Balances for regular shares and deposits increased 8.1% year-over-year and totaled $434.3 billion as of third quarter 2017. The portion of the deposit portfolio held by regular shares and deposits increased 50 basis points year-over-year to 37.3%. Credit unions also reported robust growth in share drafts. As of third quarter, share drafts comprised 15.4% of the deposit portfolio, a year-over-year jump of 39 basis points.
Credit unions also reported positive year-over-year growth in share certificates, but this product has continued to lose ground in relation to other share types. Certificates represented 18.1% of all shares as of third quarter 2017. That’s down 23 basis points in the past year and 4.6 percentage points in the past five years. Share certificate balances have increased 4.2% over the past five years to $210.5 billion; however, that growth is not fast enough to keep up with other share products.
Money market shares are the second largest segment of the deposit portfolio; however, their portion of the portfolio decreased 20 basis point to 22.4% as of Sept. 30, 2017. This despite the fact credit unions have increased money market balances $14.2 billion in the past year to top $261.3 billion.
Callahan’s Peer-to-Peer quickly shows how your credit union stacks up against peers for key share-related metrics. Learn more today.
IRA/Keough accounts were the only share product to record decreasing annual balances. Down 14 basis points to $79.0 billion since third quarter 2016, the share of the portfolio for these accounts decreased 46 basis points year-over- year to 6.8%.
Click the graphs below to enlarge and then continue reading to see how direct deposit has taken on new meaning at Wescom Credit Union.


The median share balance for the industry increased 3.5% year-over-year. Credit unions in the top 20th percentile reported an increase of 3.5%, and those in the bottom 20th percentile reported a 5.1% increase.
CASE STUDY
WESCOM CREDIT UNION
Direct deposit has taken on new meaning at Wescom Credit Union, where new coin-counting allow members to deposit cash directly into a checking or savings account.
The machines save time for members, who don’t have to take the receipt to the teller window, and for tellers, who don’t have to manually process deposits.
Wescom presents the coin counters as private coin booths a nod to its roots as a telcom credit union and, so far, the booths have proven popular.
Deposits via minted currency have jumped since Wescom rolled out the coin counters across its 22-branch network throughout 2016.
The credit union has more than 190,000 members who have brought in $347,202.39 per month on average in coin deposits this year through October.
For the year, the credit union expects to end up at $4.2 million in pennies, nickels, dimes, quarters, and the occasional 50-cent piece and dollar coin. That compares to $3.9 million for 2016, while the new machines were being placed, and $3.7 million in coins in 2013, when the monthly average was $304,849.02.
According to Kathie Chism, vice president of branch operations for 11 of the credit union’s locations, approximately 80% of the deposits go into checking accounts. With a $541.1 million balance in share draft accounts as of third quarter 2017, that might seem like small change, but that’s not what this is all about.
We’ve had coin machines since 2006, Chism says. It’s like an ATM. Once you have it there, you can’t really pull it out.
So, Wescom improved it instead.

Strategy Performance 3Q 2017
Credit unions have made significant gains since the Great Recession started 10 years ago. Third quarter credit union growth trends surged past that of community banks and the overall banking industry. Measures such as loans, shares, capital, and membership have all reached new levels. These gains are all notable and meaningful; however, they are backward-looking. The important question to ask is: Where will credit unions be in the next 10 years? In this issue of Strategy Performance, learn why now is the time for credit unions to challenge themselves.