The first quarter of the year is an opportunity for credit unions to measure early successes and determine whether operational adjustments must be made to ensure the institution will be able to meet strategic goals. Successful business strategies are data-driven and effective performance measurement is the key to unlocking insights that are most relevant to a financial cooperative. With the right combination of metrics, credit unions will be able to identify early indicators of performance so that executives can assess whether strategic adjustments must be made to keep a business on track.
These three metrics will introduce how credit unions benchmark performance in the beginning of the year and how these measures are used to drive strategic decisions:
No. 1: Share Growth
In an industry of tightening liquidity, share growth is crucial to a credit union’s ability to attract deposits that will be used to serve their growing membership base. Share growth, the period-to-period change of total share balances, is a major factor in determining whether a credit union can continue to make loans at the pace the market demands. Therefore, it is important to monitor this ratio relative to marketing efforts for deposit products.
The largest inflows of deposits typically occur in the first quarter of the year and as such, gains in the quarter are highly indicative of a credit union’s ability to serve the lending needs of its membership base. In the first quarter of 2019, Callahan’s analysts projected shares to grow 5.9% year-over-year, driven by growth in share certificates which were projected to have grown 18.2% year-over-year.
SHARE GROWTH
FOR U.S. CREDIT UNIONS | DATA AS OF 12.31.18
Callahan & Associates | CreditUnions.com
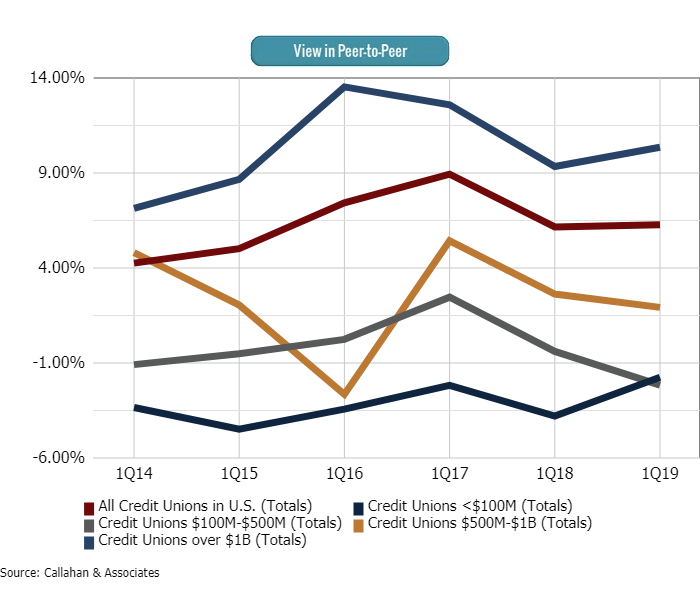
Highest gains in share growth nationally was led by credit unions with over $1 Billion in assets.
No. 2: Loan-to-Share Ratio
The relationship between a credit union’s loan and deposit acquisition performance drives its loan-to-share ratio. Financial cooperatives, as a whole, are growing loans at a faster pace than they are able to attract deposits which directly impact their loan-to-share ratio.
The loan-to-share ratio divides the total amount of loans outstanding by the total amount of share deposits at a credit union. Based on early projections by analysts at Callahan and Associates, the loan-to-share ratio national average as of the 1st quarter of 2019 grew to 82.3% compared to 69.1% in the first quarter of 2014. In general, a higher loan-to-share ratio indicates greater profitability. However, as liquidity tightens, credit unions must monitor this ratio to ensure it has sufficient deposits to provide for the lending needs of its growing membership base.
LOAN-TO-SHARE RATIO
FOR U.S. CREDIT UNIONS | DATA AS OF 12.31.18
Callahan & Associates | CreditUnions.com
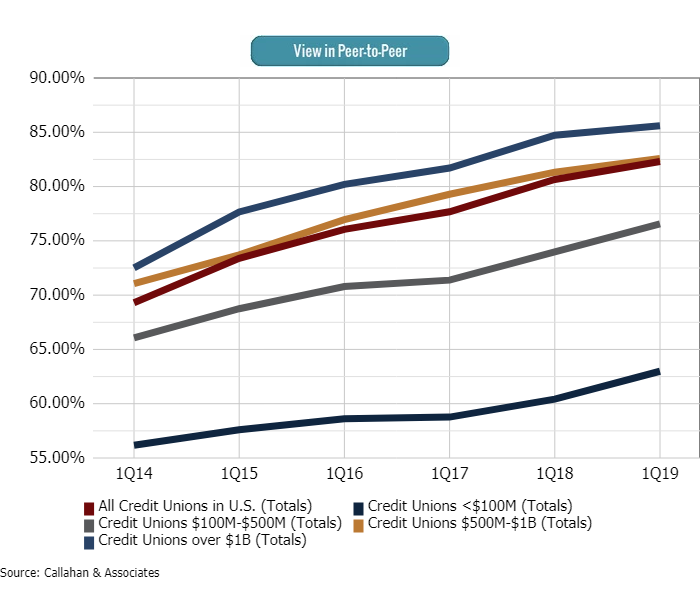
Loan-to-share ratio in credit unions across all asset bands climbed steadily over the past five years as a result of sustained loan growth.
No. 3: Net Interest Margin
Net interest margin (NIM) is a metric used by credit unions to monitor their ability to sufficiently generate income from loans and investments to cover operating expenses. It is impacted by credit unions’ successful execution of lending, investing, and liquidity strategies. Historically, NIM helps measure and manage an institution’s profitability.
NIM is expressed as a ratio and calculated by total interest income (from loans and investments) less total interest expense (cost of funds from all deposits and borrowings) divided by average assets.
Due to the rising rate environment and growth in overall portfolio size, NIM has grown steadily year-over-year in the past five years. In the first quarter of 2019, NIM was projected at 3.11% compared to 2.80% in the first quarter of 2018. Credit unions should review and identify additional opportunities to continue gains in their investment portfolio yields through liquidity analysis and effective cash flow management.
NET INTEREST MARGIN
FOR U.S. CREDIT UNIONS | DATA AS OF 12.31.18
Callahan & Associates | CreditUnions.com
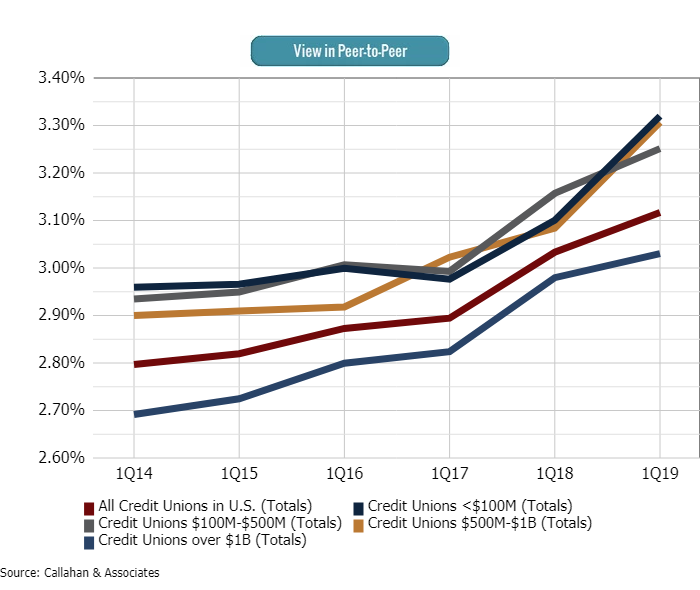
In the past five years, steady growth in NIM was led by credit unions sized $500M-$1B and under $100M in assets.
The metrics above are just a few that financial cooperatives utilize to gain performance and competitive insights. A comprehensive analysis will take these metrics along with other key performance measures such as membership growth, operating expense ratios, and more to provide a holistic view that will drive effective business strategy.
Data presented was based on Callahan and Associates’ first quarter 2019 early look NCUA data as of June 3, 2019.