Callahan & Associates hosted its quarterly Trendwatch webinar on Thursday, providing an overview of second quarter credit union trends. Of note, the industry continues to grow both sides of the balance sheet, yielding positive performance metrics and revealing areas of opportunity.
Here are three takeaways from this must-watch event:
No. 1: Net Interest Margin Exceeds Operating Expense Ratio
The industry’s net interest margin is up 11 basis points year-over-year, to 3.18%, as of June 2019, while the operating expense ratio increased 6 basis points to 3.17%. This is the first time since 2011 that credit unions are earning more on their interest margin than they’re paying in expenses. Over the past five years, the credit union net interest margin has increased 36 basis points while the operating expense ratio is up just 10 basis points which has led to credit unions generating higher profits at second quarter of 2019. The industry’s return on assets (ROA) jumped 6 basis points year-over-year, and 15 basis points over the past five, to reach to 0.96% as of June 2019.
NET INTEREST MARGIN VS. OPERATING EXPENSE RATIO
FOR U.S. CREDIT UNIONS | DATA AS OF 06.30.19
Callahan & Associates | CreditUnions.com
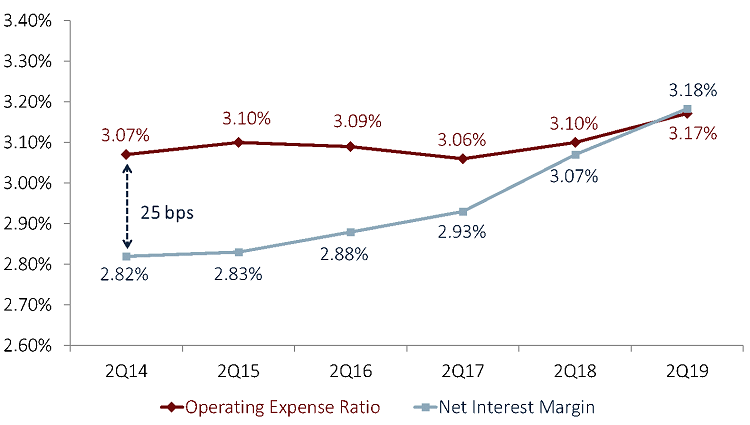
The net interest margin exceeds the operating expense ratio for the first time since 2011.
No. 2: Share Certificate Growth Exceeds 20%
In response to tightening liquidity nationwide, share certificate balances increased $49.9 billion since June 2018 as balances now total $267.7 billion as of June 2019. Certificate growth accelerated 13.5 percentage points over the past 12 months to 20.6%. Certificate balances make up 20.7% of the overall deposit portfolio, second only to regular share accounts. The overall share portfolio expanded 6.1% year-over-year to just under $1.3 trillion, a 66-basis point acceleration from the year prior. Although every deposit segment increased balances over the past 12 months, certificates contributed 61.7% of the total increase in the share portfolio.
12-MONTH GROWTH IN SHARES SEGMENTS
FOR U.S. CREDIT UNIONS | DATA AS OF 06.30.19
Callahan & Associates | CreditUnions.com
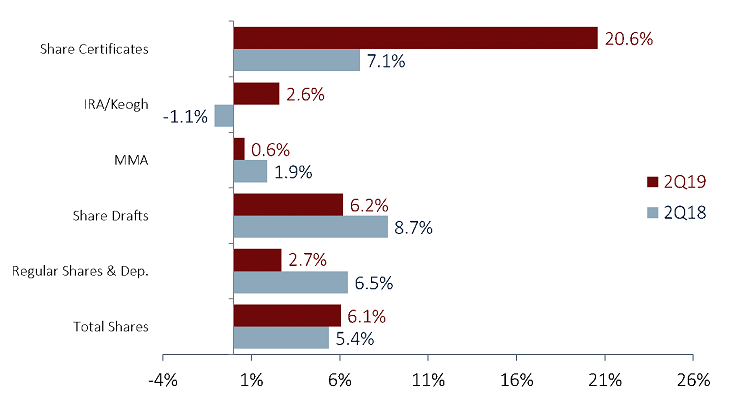
Certificate growth accelerated more than 13 percentage points year-over-year. The product now makes up 20.7% of total deposits at U.S. credit unions.
No. 3: Loan-To-Share Ratio Reaches Highest Second Quarter Rate On Record
The loan-to-share ratio continues climb, up 37 basis points year-over-year to reach 83.3%. Annual loan growth has outpaced share growth in every second quarter since 2011. However, loan growth has begun to slow down, decelerating 3.2 percentage points in the past 12 months, to 6.5%. On the other hand, driven largely by certificates, share growth accelerated 66 basis points from the rate reported last year, to 6.1% annually. This has caused the rising loan-to-share ratio to begin to plateau. Between June 2017 and June 2018, the loan-to-share ratio rose 3.3 percentage points, which is 2.9 percentage points faster than it did over the past 12 months.
LOAN-TO-SHARE RATIO
FOR U.S. CREDIT UNIONS | DATA AS OF 06.30.19
Callahan & Associates | CreditUnions.com
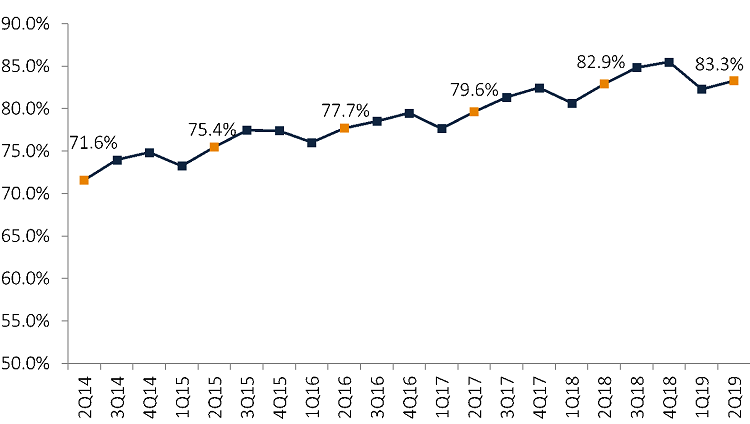
The loan-to-share ratio reached the highest rate ever reported in the second quarter, at 83.3%.
How Do You Compare?
These are just three takeaways from Trendwatch 2Q 2019. Go beyond the national averages and dive deeper into individual credit unions, peer groups, state, and more using Peer-to-Peer. Let us walk you through your numbers with a custom performance scorecard.
Learn More
Missed Trendwatch? Watch Here