Top-Level Takeaways
-
Member growth tailed slightly year-over-year but still is historically strong.
-
Auto and share draft penetration lead the way to new high water marks for member engagement.
Americans continue to join credit unions in record numbers. Each person joins for their own reasons, but together they’re energizing a movement that now accounts for more than one-third of the U.S. population.
They may be attracted to higher interest on their savings and lower interest on their loans than competing banks. They also may be attracted to the member-focused, not-for-profit model that often comes with a heavy dose of financial wellness.
Mergers and expanding fields-of-membership are a few ways that individual credit unions can grow their membership base. Quality member service and keeping up with technology also help the cause, and credit unions aren’t shy about making sure Americans know the difference this type of financial institution can make.
We’re seeing credit unions investing time and energy into creating experiences beyond rates to attract new members, says Alix Patterson, chief experience officer at Callahan & Associates.
Those experiences include being exposed to increased marketing and sharing more of the profits. Marketing expenses per member increased 50 cents year-over-year, from $14.23 in March 2018 to $14.73 as of March 2019.
Simultaneously, total dividends given to members in the first quarter of 2019 was 52.1% higher than the first quarter of 2018. Dividends across the country totaled $2.7 million and averaged $23 per member.
Click the tabs below to view graphs.
MEMBERSHIP AND ANNUAL GROWTH
MEMBERSHIP AND ANNUAL GROWTH
FOR U.S. CREDIT UNIONS | DATA AS OF 03.31.19
Callahan & Associates | CreditUnions.com
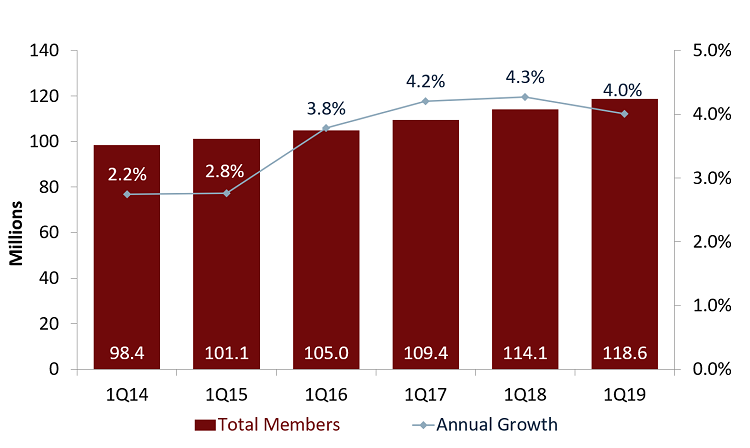
Credit union membership nationally has grown by 20.5% in the past five years, with growth rates reaching or exceeding 4.0% annually for the past three.
AVERAGE MEMBER RELATIONSHIP
AVERAGE MEMBER RELATIONSHIP
FOR U.S. CREDIT UNIONS | DATA AS OF 03.31.19
Callahan & Associates | CreditUnions.com

The average member relationship at U.S. credit unions has grown 19.9% in the past five years as consumers deepen their engagement with their member-owned cooperatives.
SHARE DRAFTS AND SHARE DRAFT PENETRATION
SHARE DRAFTS AND SHARE DRAFT PENETRATION
FOR U.S. CREDIT UNIONS | DATA AS OF 03.31.19
Callahan & Associates | CreditUnions.com
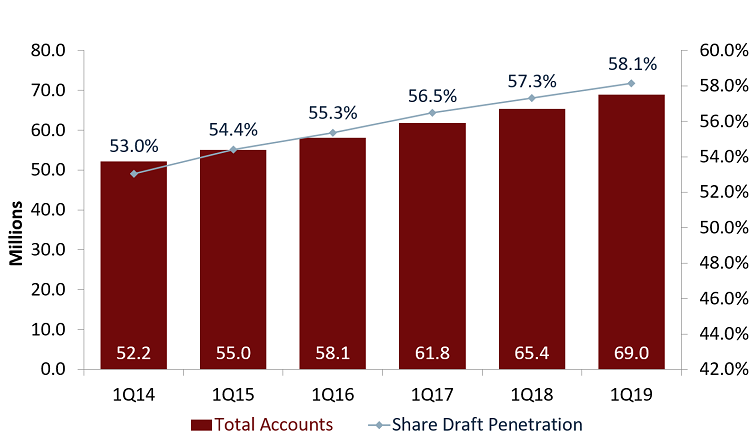
Another key indicator of member engagement, share draft penetration has grown 9.6% nationally in the past five years. At the same time, the number of share accounts grew by 32.2%, reaching 69 million as of March.
PENETRATION RATES
PENETRATION RATES
FOR U.S. CREDIT UNIONS | DATA AS OF 03.31.19
Callahan & Associates | CreditUnions.com
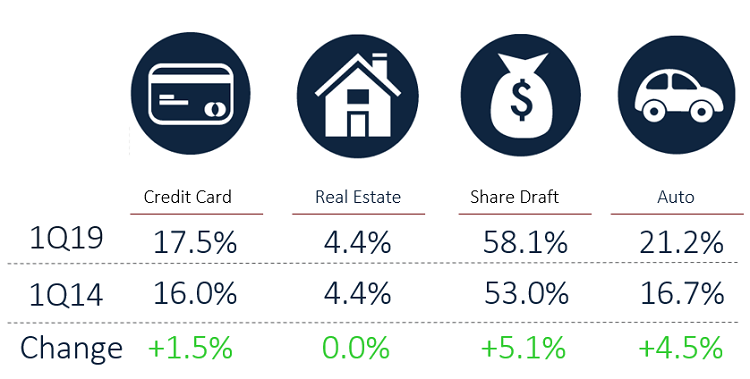
The credit union movement’s share of auto loans has grown the most in the past five years among these four major measures of member engagement.
12 MO. LOAN GROWTH BY TYPE
12 MO. LOAN GROWTH BY TYPE
FOR U.S. CREDIT UNIONS | DATA AS OF 03.31.19
Callahan & Associates | CreditUnions.com

All five major categories of consumer lending have grown significantly in the past year at America’s 5,451 credit unions operating at the end of the first quarter of 2019.
12 MO. SHARE GROWTH BY TYPE
12 MO. SHARE GROWTH BY TYPE
FOR U.S. CREDIT UNIONS | DATA AS OF 03.31.19
Callahan & Associates | CreditUnions.com

Members searching for yield and credit unions seeking to fuel their lending engines helped drive a sharp growth in share certificates at America’s credit unions in the past 12 months.
MEMBER GROWTH BY REGION
MEMBER GROWTH BY REGION
FOR U.S. CREDIT UNIONS | DATA AS OF 03.31.19
Callahan & Associates | CreditUnions.com
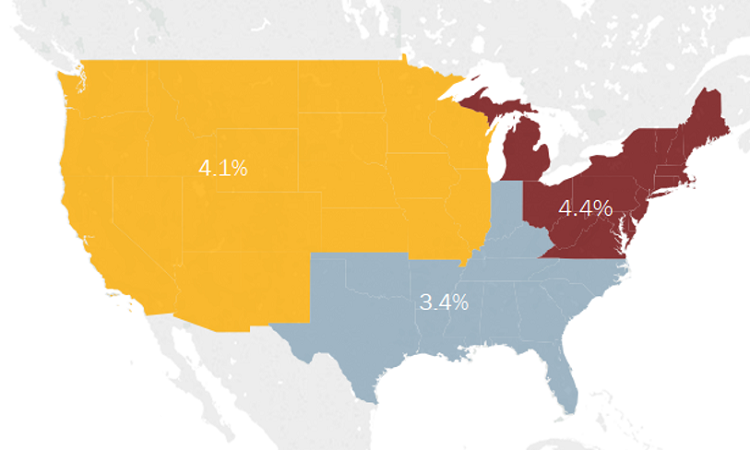
According to the NCUA’s three regions, membership growth across the country was fairly evenly distributed year-over-year in the first quarter of 2019, with the Eastern Region leading the way.
Measures of Growth
So, how much are they growing? There were 5,451 credit unions in the Callahan & Associates database at the end of the first quarter of 2019, compared to 5,530 at the same point of 2018. Those 5,451 cooperatives added 4.6 million members in the past year, and first-quarter growth itself has stayed at 4% or greater for the past three years.
This growth rate far exceeds the population growth rate of 0.60% for the U.S. itself. Currently, there are about 327.2 million U.S. residents and 118.6 million U.S. credit union members.
This is not a new trend. Nationally, credit union membership has grown by more than 20% in the five years, and in the past 10 years, has increased 31.02%, surging from 90.5 million in March 2009 to 118.6 million in March 2019.
Member growth is not even across asset classes. The 312 credit unions with assets above $1 billion in the first quarter grew their membership 6.4% year-over-year and account for 70.7 million of the 118.6 million total membership. The 261 credit unions in the
$500 million to $1 billion group grew 3.4% to 15.0 million members.
The 1,053 credit unions in the $100 million to $500 million peer group grew 2.0% in the first quarter to reach 21.5 million members. The only group that saw a decrease was the largest group of all: the 3,819 credit unions of $100 million in assets or less. They fell 0.18% over the past year and now account for 11 million members.
Measures Of Engagement
Credit unions are not only recruiting new members, but enticing members to use more products and use those products more.
Overall, the average member relationship loan balances excluding member business plus share balances was $19,156 as of March 2019, up $3,175 from the first quarter of 2014. Driving that most recently is a 1.6% increase year-over-year in the average share balance to $10,756 and the average loan balance jumping 5.0% to $8,400.
How Do You Compare?
It takes minutes to compare various aspects of your organization’s portfolio to other credit unions with Callahan Analytics. Compare against credit unions in your state, asset range, or by business model.

Drilling down, we can see that strong performance occurring across the product set. The first mortgage market share was a healthy 8.0% at the end of the first quarter, while the credit card market share was 6.1%. Some data is not yet final on the state level, but currently the movement’s share of the national auto lending market is 18.6% for the first quarter.
Now, let’s look at penetration rates within the credit union membership. The credit card penetration rate was 17.5% at quarter’s end, up 1.5 percentage points from the same quarter in 2014. Real estate penetration was level at 4.4% then and now.
Auto penetration continues to be a particularly strong spot. Fully 21.2% of credit union members have such loans at their cooperative, up 60 basis points in the past year and 450 basis points from this point five years ago. New auto loans, in fact, were the fastest-growing loan product in the past year, jumping 12.1%.
And perhaps even more striking is share draft penetration, considered a good measure of how many members are looking to credit unions as their primary financial institution. Share draft penetration stood at a record high of 58.1%, up more than 5 percentage points from the 53.1% notched in the first quarter of 2014.
Portfolio Dynamics
The combination of rising new car prices and the record number of used vehicles on the market, and entering the market off-lease, has contributed to much more competitive pricing dynamics in recent years, says Sam Taft, Callahan’s associate vice president of analytics and business development.
With the growth of auto loans over the past five years we have seen a pronounced shift in the makeup of the average credit union portfolio since 2014, Taft says.
Indeed, real estate loans have historically made up the majority of the loan portfolio. However, this concentration has fallen 3.0 percentage points in the past five years to 49.6% of total loans in 2019. Auto loans increased their share of the loan portfolio in that same period, from 31.1% of the portfolio in the first quarter of 2014 to 34.9% in the first quarter of 2019.
The Deposit Side Of The Bottom Line
Similar dynamism exists on the other side of the balance sheet, where interest rates that have come up from rock bottom have sparked interest in savings products, at the same time as many credit unions are incenting such deposits as a way to fund a growing appetite for loans.
The fastest-growing share product is certificates. As a whole, share certificates grew 18.0%, or $38.5 billion, year-over-year to $256.9 billion as of the first quarter of 2019. This product accounted for 30.6% of total share growth over the first quarter of 2019 and 55.8% of the share growth for the entire year.
The bread and butter, however, remains regular shares, which at 37.0%, comprised the largest portion of the total share portfolio. Up 3.9% annually, regular share balances reached $477.2 billion as of March 2019. The next largest piece of the deposit portfolio, money market shares, increased 0.2% to total $267.0 billion.
Also noteworthy, IRA/Keogh accounts are growing, too, as members are looking at credit unions long term when it comes to saving for their futures, just another indicator of their deepening relationship with their cooperatives as critical providers of financial services.