Top-Level Takeaways
-
Credit union branch numbers are declining even as membership in the movement grows.
-
To accommodate the growing volume of members, credit unions have increased their digital capabilities and deployed flexible staffing models.
The number of branches operated by U.S. credit unions continues to decline, but surviving locations are evolving to encompass all aspects of retail delivery.
There were 18,135 credit union branches operating in the United States as of June 30, 2018, according to data from Callahan & Associates. That’s 646 fewer than one year earlier, which translates to an annual decline of 3.4%. During the same period, banks increased their overall branch count by 0.3%, or 296 branches, bringing their total count to 87,971 as of June 30. Banks report branch-level data only in the second quarter of the year. Callahan analysts use credit union branch data from the same quarter for uniform comparative analysis.
Along with branch count, the total number of credit unions in the United States has also dropped. The 5,596 operational credit unions as of June 30, 2018, represented an annual decrease of 3.8%. Total membership, on the other hand, is on the rise. It increased 4.3% to 115.4 million. The average number of members per credit union consequently rose 8.0% from 5,891 in the second quarter of 2017 to 6,362 in the second quarter of 2018. To accommodate the growing volume of members, credit unions have increased their digital capabilities and deployed flexible staffing models.
Branching Efficiency
Credit unions nationwide are lowering overhead expenses by reducing branch counts and pushing members toward online and mobile channels. In the branch, they’re encouraging members to use digital channels such as in-branch ITMs or tablet-equipped kiosks for routine transactions and applying a universal employee model to encourage more productive face-to-face interactions.
The efficiency ratio, including the provision for loan loss, at U.S. credit unions was 78.1% as of March 31, 2019. That’s a drop of 2.6 percentage points since the first quarter of 2014. The efficiency ratio measures how much a credit union spends to earn $1, so lower numbers are generally more desirable. Additionally, credit unions generated $3.24 per dollar spent on salaries and benefits in the first quarter of 2019. That’s up 3.2% in the past year and 10.2% in the past five, a potential sign the reimagined models are creating more-productive employees.
Annualized operating expenses as of March 31 increased 7.2% year-over-year, from $43.6 billion to $46.8 billion. However, thanks in part to a rising rate environment, interest income grew 16.5%, from $51.3 billion in the first quarter of 2018 to $59.8 billion one year later, eliminating the gap between the operating expense ratio and the net interest margin.
From the first quarter of 2018 to the first quarter of 2019, the operating expense ratio increased 3 basis points while the net interest margin rose 9. As of March 2019, both ratios were equal at 3.12%. Just five years ago, the operating expense ratio was 24 basis points higher than the net interest margin. Current performance signifies credit unions are covering operating costs through the margin they collect from interest-earning assets. Accordingly, the average return on assets (ROA) increased 5 basis points year-over-year to 0.95%.
$ REVENUE PER $ SALARY AND BENEFITS
FOR U.S. CREDIT UNIONS | DATA AS OF 03.31.19
Callahan & Associates | CreditUnions.com
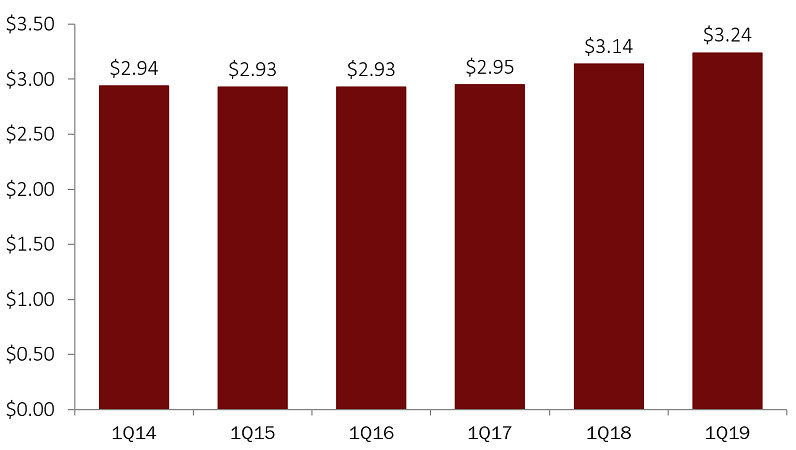
The amount of revenue generated per dollar spent on salary and benefits among America’s credit unions has risen 10.2% in the past five years.
EFFICIENCY RATIO (INCL. PLL)
FOR U.S. CREDIT UNIONS | DATA AS OF 03.31.19
Callahan & Associates | CreditUnions.com
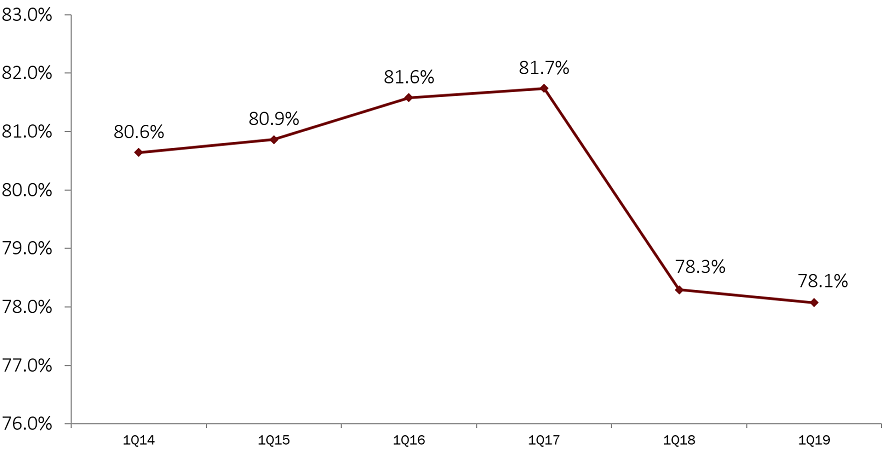
The efficiency ratio, which represents how much it costs a credit union to generate $1 in revenue, has dropped 2.6 percentage points in five years to 78.1% as of March 31, 2019. This is due largely to retail delivery, including branching, becoming more efficient.
NET INTEREST MARGIN VS. OPERATING EXPENSE RATIO
FOR U.S. CREDIT UNIONS | DATA AS OF 03.31.19
Callahan & Associates | CreditUnions.com
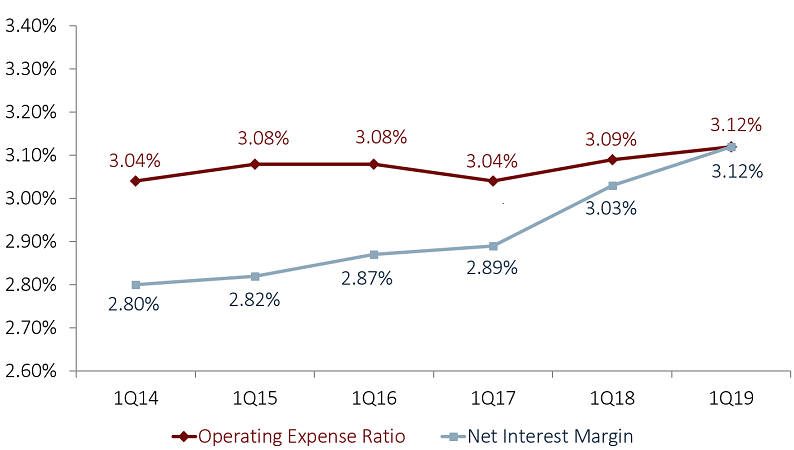
The operating expense ratio and net interest margin increased 3 and 9 basis points, respectively, both reaching 3.12% as of March 31, 2019. In the first quarter of 2014, the operating expense ratio exceeded the net interest margin by 24 basis points.
DELIVERY CHANNEL DEPLOYMENT & ONLINE INTERACTION
FOR U.S. CREDIT UNIONS | DATA AS OF 03.31.19
Callahan & Associates | CreditUnions.com
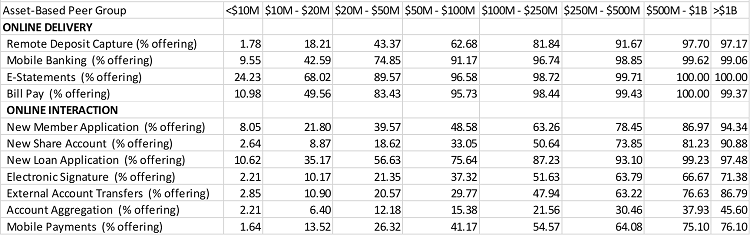
Larger credit unions, which can take advantage of economies of scale, are more likely to offer a variety of electronic services.
MEMBERSHIP AND ANNUAL GROWTH
FOR U.S. CREDIT UNIONS | DATA AS OF 03.31.19
Callahan & Associates | CreditUnions.com
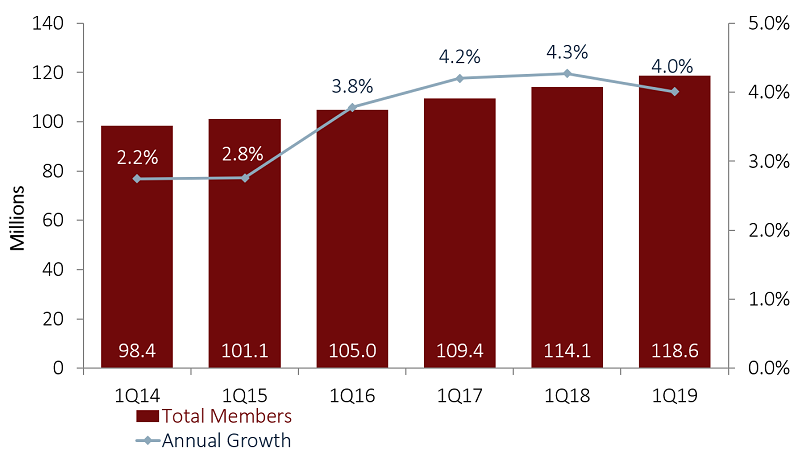
Credit union membership in the United States has grown 20.5% in the past five years. As of March 31, credit unions reported 118.6 million members. That’s 36.1% of the total U.S. population, which was 328.2 million as of Jan. 1, 2019, according to the U.S. Census Bureau.
AVERAGE MEMBER RELATIONSHIP
FOR U.S. CREDIT UNIONS | DATA AS OF 03.31.19
Callahan & Associates | CreditUnions.com
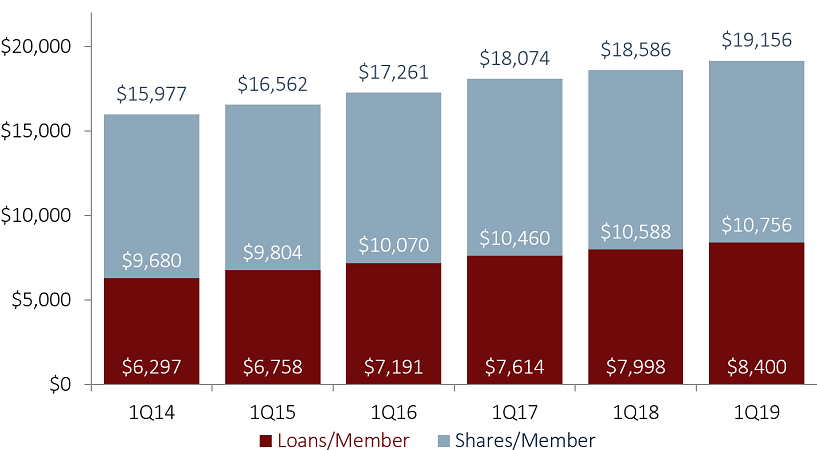
The average member relationship among U.S. credit unions has increased 19.9% since 2014. It exceeded $19,000 in the first quarter of 2019.
PENETRATION RATES
FOR U.S. CREDIT UNIONS | DATA AS OF 03.31.19
Callahan & Associates | CreditUnions.com
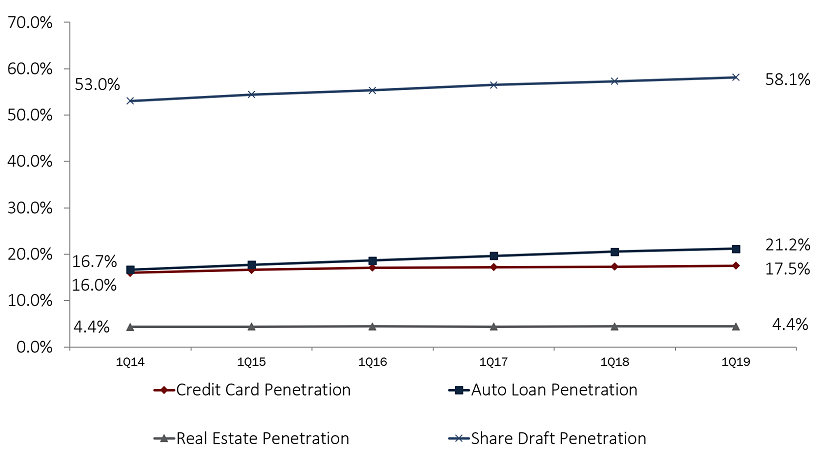
Member penetration in credit cards, auto loans, and checking accounts has grown strongly over the past five years; the proportion of members with a mortgage has held steady.
Adding Members
Total credit union membership approached 120 million in the first quarter of 2019. From March 31, 2018, to March 31, 2019, credit unions added approximately 5 million new members, a growth rate five times that of the U.S. population (0.62% for 2017-2018) and the fastest recorded since 2002.
Despite the declining number of physical branch locations, cooperative membership increased 4.0% year-over-year. But credit unions haven’t simply added members, they’ve deepened relationships. The average member relationship reached $19,156 in the first quarter of 2019, a $570 increase in the past year. Broken out, the average loan balance per member increased 5.0% year-over-year to $8,400; the average share balance per member increased 1.6% annually to $10,756.
Product penetration also is increasing across the board. Most notably, share draft penetration has risen 5.1 percentage points in the past five years to 58.1% as of March 31, 2019. Credit card, auto, and real estate penetration rates are up 1.5, 4.5, and 0.1 percentage points, respectively, from five years ago.
Market share metrics at U.S. credit unions have improved, too, in all major loan products. Cooperatives financed 18.6% of auto loans nationwide as of March 31, 2019. That’s up 3.6 percentage points from five years ago. Credit unions funded 8.0% of all mortgages in the first quarter. That’s up 1.6 percentage points from 2014. And, credit card market share was 6.1% as of the first quarter, up 90 basis points over the same five-year period.
Larger credit unions, employing economies of scale, often offer a more diverse range of electronic delivery channels than their smaller counterparts. For example, fewer than 2.0% of the 1,403 credit unions with less than $10 million in assets offered remote deposit capture and only 9.6% offered mobile banking as of March 31, 2019. Alternatively, among credit unions with more than $1 billion in assets, 97.2% offered remote deposit capture and 99.1% offered mobile payments. As the table displays, these percentages are heavily correlated with the asset range of credit unions.
It is almost impossible to maintain a physical presence in every location a member or potential member might live. However, technology enables credit unions to offer a supplementary, centralized virtual support model that accommodates the changing needs of members while offering consistent and reliable service.