The 60 member-owned credit unions in Nebraskans reported lending growth that exceeded national averages. Annual growth in loan originations was 6.9% at year-end, outpacing the 5.3% growth recorded by all 5,492 U.S. credit unions at year-end.
In dollar terms, loan originations for credit unions in the Cornhusker State reached $1.7 billion, which helped push total originations for all U.S. credit unions to exceed $500 billion for the first time.
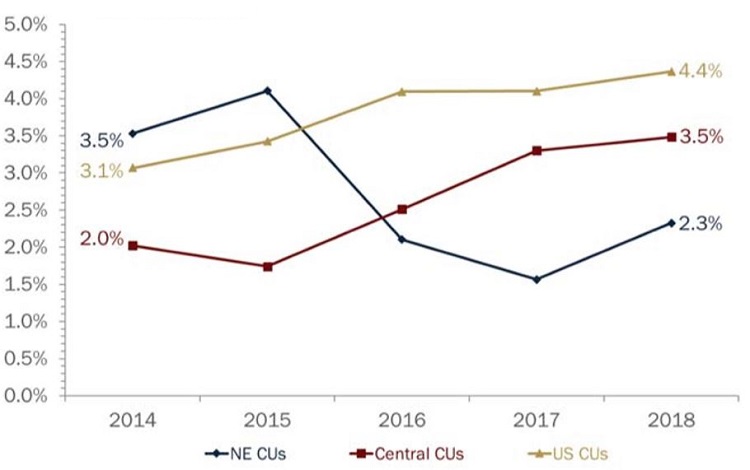
ANNUAL LOAN GROWTH
FOR U.S. CREDIT UNIONS | DATA AS OF 12.31.18
Callahan & Associates | CreditUnions.com

Annual loan growth at Nebraska credit unions increased 95 basis points from year-end 2017 to year-end 2018. Credit unions here fared better than credit unions in the Central Region and nationally, which recorded a slowdown of 8 and 97 basis points, respectively.
But that’s not all. Credit unions in Nebraska recorded positive performance in all the major metrics.
According to a report from Callahan & Associates commissioned by the Nebraska Credit Union League, the state’s credit unions increased loan balances by 5.9% and shares by 3.0%, pushing the state’s loan-to-share ratio to 88.7% and boosting total share balances to nearly $3.9 billion.
That 3.0% growth was 1 basis point faster than in the fourth quarter of 2017. Share certificates, particularly, showed some strength, jumping 11.9% annually as members took advantage of high rates and repriced term deposit products.
LOAN-TO-SHARE RATIO
FOR U.S. CREDIT UNIONS | DATA AS OF 12.31.18
Callahan & Associates | CreditUnions.com

The loan-to-share ratio at Nebraska credit unions increased 2.5 percentage points to 88.7% at year-end 2018. For all U.S. credit unions, it is 85.5%.
Rising interest rates for loans and investments helped Nebraska credit unions grow total interest income by 10.8% year-over-year in 2018, even while the investment portfolio contracted by 5.6% as cooperatives there sold holdings to help fund lending.
The state’s spread between interest income and interest expense rose $10.8 million from year-end 2017 to year-end 2018. Operating expenses, meanwhile, expanded at a slower pace, helping lead to a 29.8% increase in net income.
That, in turn, helped Cornhusker cooperatives increase ROA by 16 basis points and reach 0.74% as of Dec. 31, 2018. The average for the NCUA Central Region was 0.84% at year-end and the ROA for all 5,492 U.S. credit unions was 0.92%.
NET INTEREST MARGIN
FOR U.S. CREDIT UNIONS | DATA AS OF 12.31.18
Callahan & Associates | CreditUnions.com

Nebraska credit unions posted a net interest margin of 3.31% in the fourth quarter of 2018, exceeding their national and regional averages.
In the decade since the financial crisis, Nebraska credit unions have reflected the national experience it terms of growing membership, lending, and deposits amid contracting numbers. There were 7,967 U.S. credit unions as of Dec. 31, 2008; 73 of them were based in Nebraska. As of Dec. 31, 2018, those numbers were 5,492 and 60, respectively.
Nationally, membership has grown 30.8% over the past 10 years to 117.6 million. In Nebraska, membership has grown 27.5% to 521,900. The state had 1.93 million residents in 2018, according to the U.S. Census.
MEMBER GROWTH
FOR U.S. CREDIT UNIONS | DATA AS OF 12.31.18
Callahan & Associates | CreditUnions.com
Nearly 5 million new members joined America’s credit unions in 2018, including 11,800 at the 60 credit unions based in the Cornhusker State.
Nationwide, growth that began in the Great Recession has contributed to unprecedented performance for the nation’s credit unions. In Nebraska, too, more consumers are taking advantage of the value proposition inherent in the member-owned cooperative structure.
Strong loan growth and widening margins between interest income and expenses contribute to an improved bottom line, enabling credit unions in Nebraska and beyond to invest in products and services that will maintain momentum in the months and years ahead.
Save Time. Improve Performance.
NCUA data is right at your fingertips. Build displays, filter data, track performance, and more with Callahan’s CUAnalyzer.