Top-Level Takeaways
-
Indirect loan growth at U.S. credit unions fell sharply year-over-year, driving a similar deceleration in overall auto growth.
-
Credit unions that don’t have indirect lending programs reported higher total auto loan growth rates but lag their indirect-lending peers in both volume and market share.
At credit unions nationwide, indirect loans mostly auto loans originated at the dealership and financed by credit unions grew at their lowest annual growth rate since March 2012, up only 4.6% over the last 12 months.
At a small but growing number of credit unions, indirect lending also includes such items as swimming pools, boats, and solar panels. However, auto loans still make up the majority of indirect balances, and as growth of indirect lending slows, so has the growth rate of the credit union industry’s auto loan portfolio. Year-over-year, total auto loan balances grew by 3.5%, well below the 10.8% rate reported in September 2018.
Growth and Market Share:
This trend of slowing auto loan growth is not exclusive to credit unions, as the larger auto market reported a slowdown in sales across the U.S. over the last year. Seasonally adjusted year-to-date light vehicle sales, which comprise the vast majority of consumer purchases, fell 168,000 units year-over-year to 17.1 million as of September, according to data from the Federal Reserve Bank of St. Louis.
Despite the slowdown, total auto loan balances among U.S. credit unions reached a record $378.2 billion as of September 2019 and now comprise 34.4% of the credit union industry’s loan portfolio. Still, the indirect lending deceleration has resulted in declining auto market share at cooperatives nationwide, falling from 20.4% in September 2018 to 18.4% in September 2019. Broken out, new auto market share decreased 3.4 percentage points to 16.2% and used auto share decreased 2.4 percentage points to 24.6%.
TOTAL AUTO LOANS OUTSTANDING AND ANNUAL GROWTH
FOR U.S. CREDIT UNIONS | DATA AS OF 09.30.19
Callahan & Associates | CreditUnions.com
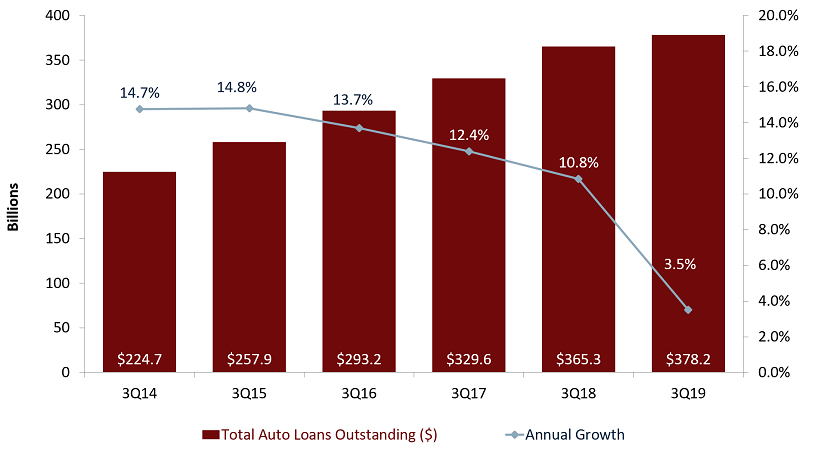
Total auto loan growth at U.S. credit unions fell sharply year-over-year in the third quarter of 2019, following several years of gradually slowing growth.
AUTO LOAN PORTFOLIO
FOR U.S. CREDIT UNIONS | DATA AS OF 09.30.19
Callahan & Associates | CreditUnions.com
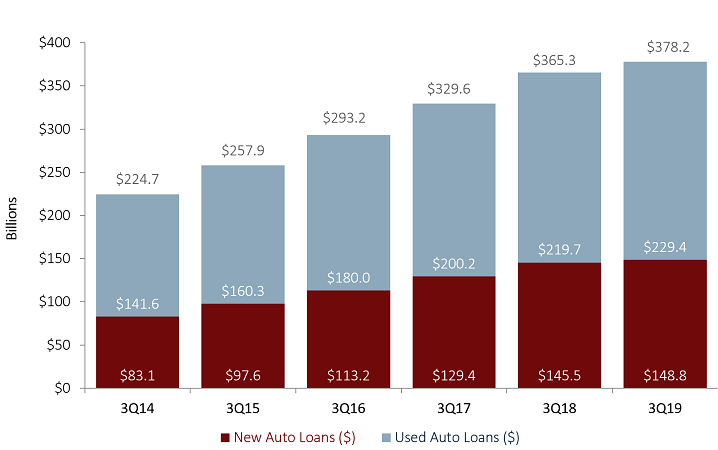
The credit union industry marked another record in total auto loan balances at $378.2 billion in the third quarter, up 68.3% in the past five years. The proportion of used and new auto loans remained steady since 2014, though used auto balances have grown slightly faster than new auto loans in the past few quarters.
AUTO LOAN PENETRATION
FOR U.S. CREDIT UNIONS | DATA AS OF 09.30.19
Callahan & Associates | CreditUnions.com

Credit unions continue to increase auto penetration rates year-over-year. In the third quarter of 2019, however, annual member growth surpassed auto loan growth for the first time since December 2011, leading to a decline in auto penetration rates since June.
AVERAGE AUTO LOAN BALANCE
FOR U.S. CREDIT UNIONS | DATA AS OF 09.30.19
Callahan & Associates | CreditUnions.com
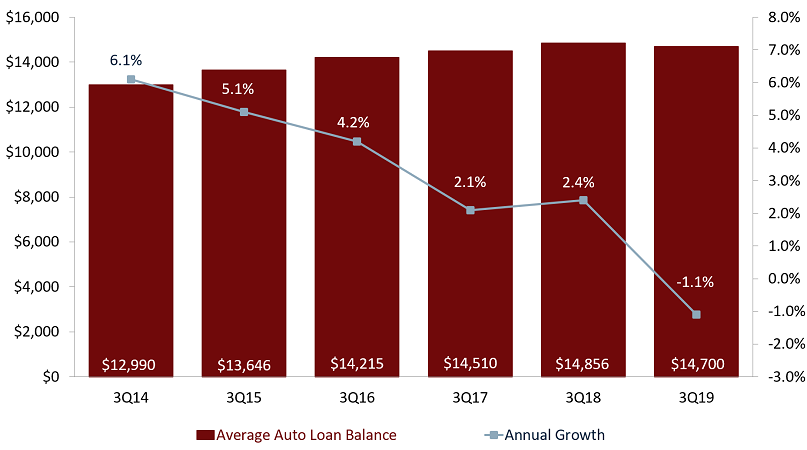
Average auto balances declined over the last year, driven by the growing demand for used cars over new. A combination of factors pushed average auto balances down 1.1% over the last year.
INDIRECT LOANS OUTSTANDING
FOR U.S. CREDIT UNIONS | DATA AS OF 09.30.19
Callahan & Associates | CreditUnions.com
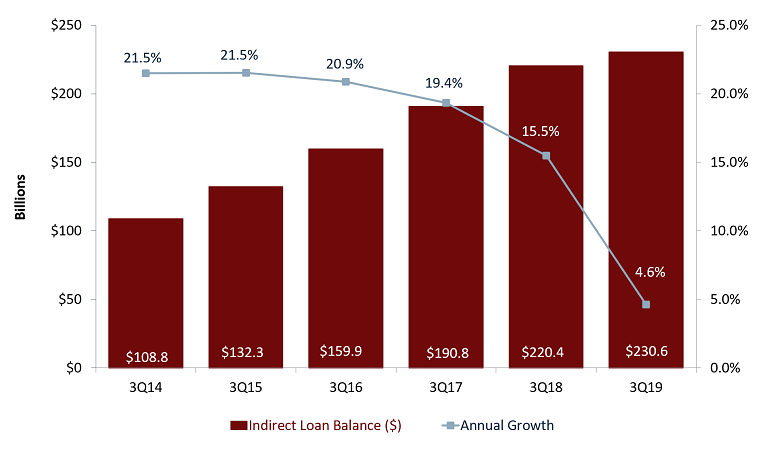
Annual indirect loan growth at U.S. credit unions decreased sharply over the last 12 months, although indirect balances are still at twice the level they were in the third quarter of 2014.
AUTO LOAN DELINQUENCY
FOR U.S. CREDIT UNIONS | DATA AS OF 09.30.19
Callahan & Associates | CreditUnions.com

Auto delinquency rates have remained steady over the past five years. New auto delinquency remained flat year-over-year at 0.39%, while used car delinquency dipped from 0.74% to 0.71%.
Credit union auto growth slowed to 3.5% year-over-year as of September 2019, the lowest annual rate since March 2012. This follows double-digit annual auto loan growth in every third quarter since 2013. New auto loans increased 2.2% over the last 12 months, while used auto loans grew 4.4%. September marks the second consecutive quarter where used growth outpaced new growth, a dynamic which had not previously occurred since the third quarter of 2012.
Indirect Lending:
The trend toward increased indirect lending began around December 2012. The 209 credit unions with the largest indirect lending portfolios today who hold 50% of the industrywide auto loan balance had 2.52 accounts per member at the end of 2012, higher than the 2.37 number for all U.S. credit unions.
Since then, loan balances at the top indirect lenders have grown much faster than the industry as a whole driven by substantial indirect lending growth but accounts per member growth has lagged, allowing the rest of the industry to begin catching up. In the third quarter of 2019, those top indirect lenders had 2.58 accounts per member versus 2.50 industrywide.
The total auto portfolio at the 1,925 credit unions with indirect programs was $319.4 million, accounting for 84.4% of nationwide auto loans. As these credit unions slow their indirect lending programs directly impacting their total auto lending businesses they have a powerful effect on the industry’s overall growth rates.
Direct Versus Indirect:
As of the third quarter, there were 3,391 credit unions that reported auto balances without indirect loans. These institutions posted stronger auto loan growth numbers than indirect lenders. Their totals:
- New auto growth=7.6% (10.0% in September 2018)
- Used auto growth=6.1% (8.0% in September 2018)
- Total auto growth=6.6% (8.7% in September 2018)
Comparatively, the slowdown reported at the 1,925 credit unions with indirect programs (direct loan balances at these institutions are also included in these rates):
- New auto growth=1.8% (13.3% in September 2018)
- Used auto growth=4.7% (10.6% in September 2018)
- Total=3.5% (11.6% in September 2018)
Broken down further, there are 209 institutions that report more than $275 million in indirect loan balances, each. These institutions report auto balances that account for over 50% of the credit union industry’s total. Their growth rates for the third quarter of 2019:
- New auto growth=0.8% (12.4% in September 2018)
- Used auto growth=5.5% (11.2% in September 2018)
- Total auto growth=3.5% (11.7% in September 2018)
Penetration Rates:
Total auto penetration rates in the industry grew 21 basis points year-over-year, from 21.1% to 21.3%. However, this growth has slowed over the past few quarters, with penetration rates staying flat between June and September 2019. As with loan growth, the industry’s penetration rate was hindered by the pullback in indirect lending.
As of the third quarter 2019, credit unions with no indirect lending programs reported increasing auto loan penetration rates quarter-over-quarter, up from 15.7% in June 2019 to 15.8% in September. However, indirect lenders penetration rates contracted slightly over the same period, falling from 23.04% to 23.02%.
Region By Region:
All regions of the U.S. report slowing indirect loan growth. The NCUA Western region reported the largest auto growth slowdown as of the third quarter. Though direct loan growth slowed as well, indirect balances reported more drastic decelerations and made up over 50% of total loan balances in all three regions, indicating that the total auto loan slowdown is predominantly driven by the pullback in indirect lending.
- Western Region
- Indirect loan growth=3.5% (15.5% last September)
- Direct loan growth=2.6% (3.0% last September)
- Total auto growth=3.2% (11.3% last September)
- Southern Region
- Indirect loan growth=4.3% (13.3% last September)
- Direct loan growth=2.6% (7.1% last September)
- Total auto growth=3.5% (10.1% last September)
- Eastern Region
- Indirect loan growth=7.1% (17.9% last September)
- Direct loan growth=0.0% (2.7% last September)
- Total auto growth=4.1% (11.0% last September)
Bottom Line:
Over the past year, U.S. cooperatives scaled back the rate at which they engage in indirect lending. This has pulled down overall auto growth, which had been growing at a consistent double-digit clip for six consecutive years. With a market influx of off-lease vehicles, credit unions particularly those involved in indirect programs are seeing a consumer push toward used vehicle loans, which will likely continue to drive average balances lower.
Indirect loans still dominate the auto loan portfolios at credit unions nationwide, but growth over the past 12 months shows that cooperatives involved exclusively in direct lending are reporting higher growth rates in both balances and member penetration as of the third quarter. Although indirect lending may have been the definitive feature of credit union auto lending over the last decade, new (and old) strategies may begin to gain prominence in the coming years.